plotpy is a set of tools for curve and image plotting (extension to PythonQwt)


Project description
See documentation for more details on the library and changelog for recent history of changes.
Copyright © 2009-2015 CEA, Pierre Raybaut, licensed under the terms of the CECILL License.
Overview
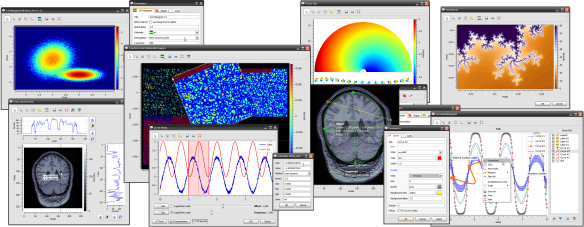
Based on PythonQwt (a pure Python/PyQt reimplementation of the curve plotting Qwt C++ library, included in plotpy base source code) and on the scientific modules NumPy and SciPy, plotpy is a Python library providing efficient 2D data-plotting features (curve/image visualization and related tools) for interactive computing and signal/image processing application development. It is based on Qt graphical user interfaces library, and currently supports both PyQt4 and PyQt5.
Extension to PythonQwt:
set of tools for curve and image plotting
GUI-based application development helpers
Building, installation, …
The following packages are required: PyQt4 (or PyQt5), PythonQwt, guidata, NumPy, SciPy and Pillow.
See the README and documentation for more details.


