Curve and image plotting tools for Python/Qt applications


Project description
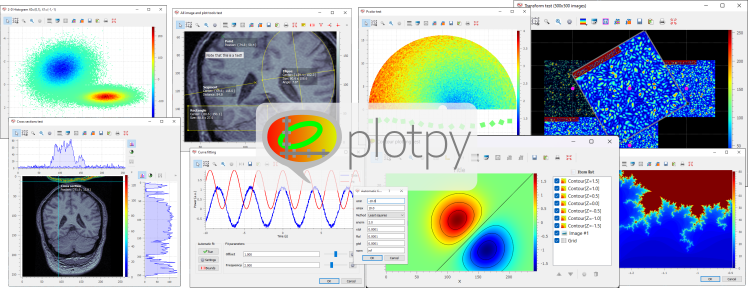
PlotPy: Curve and image plotting tools for Python/Qt applications


ℹ️ Created in 2016 by Pierre Raybaut and maintained by the PlotPyStack organization.
ℹ️ PlotPy V2 is the new major release of guiqwt: same team 🏋️, same goal 🎯, same long-term support ⏳.
Overview
plotpy is is a Python library providing efficient 2D data-plotting features
for interactive computing and signal/image processing application development.
It is part of the PlotPyStack project, aiming at
providing a unified framework for creating scientific GUIs with Python and Qt.
plotpy is based on:
- Python language and Qt GUI toolkit (via PySide or PyQt)
- guidata automatic GUI generation library
- PythonQwt plotting widgets library
- NumPy and SciPy scientific computing libraries
See documentation for more details on the library and changelog for recent history of changes.
Copyrights and licensing:
- Copyright © 2023 CEA, Codra, Pierre Raybaut.
- Licensed under the terms of the BSD 3-Clause (see LICENSE).
Features
The plotpy library also provides the following features.
General plotting features:
- Ready-to-use plot widgets and dialog boxes
- pyplot: interactive
plotting widgets, equivalent to
matplotlib.pyplot, at least for the implemented functions - Supported plot items: curves, images, contours, histograms, labels, shapes, annotations, ...
Interactive features (i.e. not only programmatic plotting but also with mouse/keyboard):
- Multiple object selection for moving objects or editing their properties through automatically generated dialog boxes
- Item list panel: move objects from foreground to background, show/hide objects, remove objects, ...
- Customizable aspect ratio for images
- Tons of ready-to-use tools: plot canvas export to image file, image snapshot, interval selection, image rectangular filter, etc.
- Curve fitting tool with automatic fit, manual fit with sliders, ...
- Contrast adjustment panel for images: select the LUT by moving a range selection object on the image levels histogram, eliminate outliers, ...
- X-axis and Y-axis cross-sections: support for multiple images, average cross-section tool on a rectangular area, ...
- Apply any affine transform to displayed images in real-time (rotation, magnification, translation, horizontal/vertical flip, ...)
Application development helpers:
- Ready-to-use plot widgets and dialog boxes
- Load/save graphical objects (curves, images, shapes) into HDF5, JSON or INI files
- A lot of test scripts which demonstrate
plotpyfeatures (see examples)
Dependencies and installation
See Installation section in the documentation for more details.
Release history Release notifications | RSS feed


Download files
Download the file for your platform. If you're not sure which to choose, learn more about installing packages.
Source Distribution
Built Distributions
Hashes for PlotPy-2.0.0-cp312-cp312-win_amd64.whl
| Algorithm | Hash digest | |
|---|---|---|
| SHA256 | 6ac77efc4c5bdb95bbd50f11228e733cf18e30f379738febdbeeaf6a047a2d0b |
|
| MD5 | 6e720b1c0a0b72abcfdd532825afa3ea |
|
| BLAKE2b-256 | 71acad5c35290aeeca8e28b3436d72c24efaaa6f956bb82cab9d9b9b60f3fcd4 |
Hashes for PlotPy-2.0.0-cp311-cp311-win_amd64.whl
| Algorithm | Hash digest | |
|---|---|---|
| SHA256 | e5c8f4363ba9b1d3c7c0969430333f5edfd3dca13a58f90b2cf67ed4154854d4 |
|
| MD5 | 7f09da179c93a1d44fc186943a687f80 |
|
| BLAKE2b-256 | 1fef011a284ebceb851669f40886f6d770976ae5a5cc6d928cf66ff9ce48d839 |
Hashes for PlotPy-2.0.0-cp310-cp310-win_amd64.whl
| Algorithm | Hash digest | |
|---|---|---|
| SHA256 | 1ae479647d992b2f0f3a6f29b6008d777a4560a467076895529dc8e8db842244 |
|
| MD5 | 0af827a8c97317c0c0ce4e313f4f253a |
|
| BLAKE2b-256 | d2bcbc2422875d6a43a89059c35ad0bbc1bf1571fe5f45b4946ae1762d4e4d3a |
Hashes for PlotPy-2.0.0-cp310-cp310-win32.whl
| Algorithm | Hash digest | |
|---|---|---|
| SHA256 | 6a3a6f589cc835b8cc6f89a9dc126e8ac433bad72fc3f69d084d7aef78d7f6ae |
|
| MD5 | ab7ac34fecc31833b7e5a1c690cc5e45 |
|
| BLAKE2b-256 | 8988fe203ba9fc8e90f4677445d06ab4154cb3a146a445169e59fd3c5dbc909d |
Hashes for PlotPy-2.0.0-cp39-cp39-win_amd64.whl
| Algorithm | Hash digest | |
|---|---|---|
| SHA256 | 9e984a7b27cef3cb312f4483a8673b9424849c6ec3726a336ad8a68cfbf533ad |
|
| MD5 | f37c5c2a86e20cf216cbfd89703afce7 |
|
| BLAKE2b-256 | 351b60479d5ba0688ec002faeb5c5bb958c6e3f5f10d91d2477b8e2648636b2d |
Hashes for PlotPy-2.0.0-cp39-cp39-win32.whl
| Algorithm | Hash digest | |
|---|---|---|
| SHA256 | ee9ae7471cab947b1fac7fab61dd766cc39d4b2e24c674caf29f12e6f645ec77 |
|
| MD5 | 0c11ee855f44ecf0d24855339f7872fc |
|
| BLAKE2b-256 | ba7e8bf006aabb603fbfcfb22a45b49de41c4b07d88c74664f19dcd3474a8e44 |
Hashes for PlotPy-2.0.0-cp38-cp38-win_amd64.whl
| Algorithm | Hash digest | |
|---|---|---|
| SHA256 | 782fdcc914600800f5740b5573e4216407742b91b14edcbb486a01572ac9101e |
|
| MD5 | e8b472290456ab77e6c347930bf1ab0a |
|
| BLAKE2b-256 | 53fa5d6e3d7e64089e12244df0da4c8ce09ca1ae1a134a743dc184697fbbe0b2 |
Hashes for PlotPy-2.0.0-cp38-cp38-win32.whl
| Algorithm | Hash digest | |
|---|---|---|
| SHA256 | faa6f674f2c20936d93b519c305f29ed910236840d8fccc2a23ab0d2926deb78 |
|
| MD5 | 6a222b732c41baa2e7151c080084b0c5 |
|
| BLAKE2b-256 | 8c84060b13e6507175bc3cf349df8cf9c4bda51cdec985f0080f03afca56bb5e |


