Curve and image plotting tools for Python/Qt applications


Project description
PlotPy: Curve and image plotting tools for Python/Qt applications


ℹ️ Created in 2016 by Pierre Raybaut and maintained by the PlotPyStack organization.
ℹ️ PlotPy V2 is the new major release of guiqwt: same team 🏋️, same goal 🎯, same long-term support ⏳.
Overview
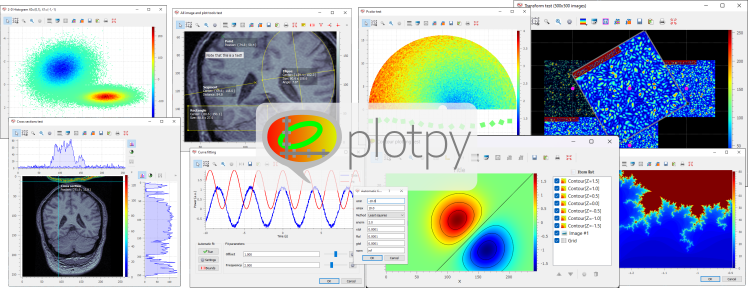
plotpy is is a Python library providing efficient 2D data-plotting features
for interactive computing and signal/image processing application development.
It is part of the PlotPyStack project, aiming at
providing a unified framework for creating scientific GUIs with Python and Qt.
plotpy is based on:
- Python language and Qt GUI toolkit (via PySide or PyQt)
- guidata automatic GUI generation library
- PythonQwt plotting widgets library
- NumPy and SciPy scientific computing libraries
See documentation for more details on the library and changelog for recent history of changes.
Copyrights and licensing:
- Copyright © 2023 CEA, Codra, Pierre Raybaut.
- Licensed under the terms of the BSD 3-Clause (see LICENSE).
Features
The plotpy library also provides the following features.
General plotting features:
- Ready-to-use plot widgets and dialog boxes
- pyplot: interactive
plotting widgets, equivalent to
matplotlib.pyplot, at least for the implemented functions - Supported plot items: curves, images, contours, histograms, labels, shapes, annotations, ...
Interactive features (i.e. not only programmatic plotting but also with mouse/keyboard):
- Multiple object selection for moving objects or editing their properties through automatically generated dialog boxes
- Item list panel: move objects from foreground to background, show/hide objects, remove objects, ...
- Customizable aspect ratio for images
- Tons of ready-to-use tools: plot canvas export to image file, image snapshot, interval selection, image rectangular filter, etc.
- Curve fitting tool with automatic fit, manual fit with sliders, ...
- Contrast adjustment panel for images: select the LUT by moving a range selection object on the image levels histogram, eliminate outliers, ...
- X-axis and Y-axis cross-sections: support for multiple images, average cross-section tool on a rectangular area, ...
- Apply any affine transform to displayed images in real-time (rotation, magnification, translation, horizontal/vertical flip, ...)
Application development helpers:
- Ready-to-use plot widgets and dialog boxes
- Load/save graphical objects (curves, images, shapes) into HDF5, JSON or INI files
- A lot of test scripts which demonstrate
plotpyfeatures (see examples)
Dependencies and installation
See Installation section in the documentation for more details.
Release history Release notifications | RSS feed


Download files
Download the file for your platform. If you're not sure which to choose, learn more about installing packages.
Source Distribution
Built Distributions
Hashes for PlotPy-2.0.1-cp312-cp312-win_amd64.whl
| Algorithm | Hash digest | |
|---|---|---|
| SHA256 | f5f4616f759d96e7f0f5f4efd96cc60d22036d0ea9000d7af13d8806d91b8082 |
|
| MD5 | e09b3d874c6d2e80e55969d6c4d074f9 |
|
| BLAKE2b-256 | 0cbac3b488dcca417361bdaf752b764382a4325759e7049289ac2be22c70d330 |
Hashes for PlotPy-2.0.1-cp311-cp311-win_amd64.whl
| Algorithm | Hash digest | |
|---|---|---|
| SHA256 | 55bb3f904c2c91eade695cecf4025e9d17d532dd401310aaf0264443da01d05c |
|
| MD5 | e8955acd18bc798181fcc08abc4ed4b6 |
|
| BLAKE2b-256 | 88956c463a3228b70a1bf2e2026fbdc9e4f8f0b00c5054ce41c0e27c98efd154 |
Hashes for PlotPy-2.0.1-cp310-cp310-win_amd64.whl
| Algorithm | Hash digest | |
|---|---|---|
| SHA256 | ff3f504a27a352b9815ffd8f3fb2f8cd633cc711f33ec3775f1ea79bddd8692e |
|
| MD5 | d0a942942dc5d6ad5832cdc46acd25bd |
|
| BLAKE2b-256 | 7de365a3dddbe29dea4f6fe1008076fb374d08fdc6a3fc0875a73e6fd820e041 |
Hashes for PlotPy-2.0.1-cp310-cp310-win32.whl
| Algorithm | Hash digest | |
|---|---|---|
| SHA256 | 35ed368f26285bec78d0741007f6f519bc5a89240c18b4e0f2606edfc943531b |
|
| MD5 | 62449332f76342cc18c811139cbc58d4 |
|
| BLAKE2b-256 | 7ce93b3bbfc44877c635557a8d1bd8c190c531ecb2c36dc17c0e024366c7dc81 |
Hashes for PlotPy-2.0.1-cp39-cp39-win_amd64.whl
| Algorithm | Hash digest | |
|---|---|---|
| SHA256 | 581eba22ae3467bab87ed9eb296c15bc7560c337c9e939a4c9440ca1bf694a85 |
|
| MD5 | 9aa9da4a3e4a7078ee000d223b78c339 |
|
| BLAKE2b-256 | 00b4f6f75f13cf6fed356a139ee8c5414d94381d29a75dce9c9f77cad3e67c82 |
Hashes for PlotPy-2.0.1-cp39-cp39-win32.whl
| Algorithm | Hash digest | |
|---|---|---|
| SHA256 | 8d3253cdb988cdea8ba3c85e18dec7f1a7bfcf845faf58a47d4a8ecfa72599c1 |
|
| MD5 | 3f881cda43ed537a596a474e2d1d8976 |
|
| BLAKE2b-256 | c427abccf1e9acfee3841fb6c941c3cdce7df5c38dbdc559be7b3ddda0da95ce |
Hashes for PlotPy-2.0.1-cp38-cp38-win_amd64.whl
| Algorithm | Hash digest | |
|---|---|---|
| SHA256 | 34514dedf74b9939038289df92c14efa153441ff2c994d69a3a7d8d68b4f0589 |
|
| MD5 | 8c4627603b411553f9f90db870ab331d |
|
| BLAKE2b-256 | 626e2148de3e133ce35a30e4220a4ff89d196d7db8db4e165ceb7329018813b1 |
Hashes for PlotPy-2.0.1-cp38-cp38-win32.whl
| Algorithm | Hash digest | |
|---|---|---|
| SHA256 | be376a50ed04d57f7295222a664408f4e9e7555a646d8edfb78189ae6d2fad39 |
|
| MD5 | e84f996b67895ec138dd66471baa9dac |
|
| BLAKE2b-256 | 62fa00c3db76d1da7e6a0676c4f0a1d016693b592762a42ff27953119c0aaf3c |


