Curve and image plotting tools for Python/Qt applications


Project description
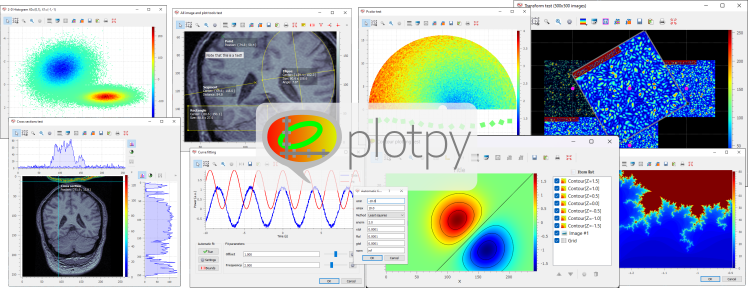
PlotPy: Curve and image plotting tools for Python/Qt applications


ℹ️ Created in 2016 by Pierre Raybaut and maintained by the PlotPyStack organization.
ℹ️ PlotPy V2 is the new major release of guiqwt: same team 🏋️, same goal 🎯, same long-term support ⏳.
Overview
plotpy is is a Python library providing efficient 2D data-plotting features
for interactive computing and signal/image processing application development.
It is part of the PlotPyStack project, aiming at
providing a unified framework for creating scientific GUIs with Python and Qt.
plotpy is based on:
- Python language and Qt GUI toolkit (via PySide or PyQt)
- guidata automatic GUI generation library
- PythonQwt plotting widgets library
- NumPy and SciPy scientific computing libraries
See documentation for more details on the library and changelog for recent history of changes.
Copyrights and licensing:
- Copyright © 2023 CEA, Codra, Pierre Raybaut.
- Licensed under the terms of the BSD 3-Clause (see LICENSE).
Features
The plotpy library also provides the following features.
General plotting features:
- Ready-to-use plot widgets and dialog boxes
- pyplot: interactive
plotting widgets, equivalent to
matplotlib.pyplot, at least for the implemented functions - Supported plot items: curves, images, contours, histograms, labels, shapes, annotations, ...
Interactive features (i.e. not only programmatic plotting but also with mouse/keyboard):
- Multiple object selection for moving objects or editing their properties through automatically generated dialog boxes
- Item list panel: move objects from foreground to background, show/hide objects, remove objects, ...
- Customizable aspect ratio for images
- Tons of ready-to-use tools: plot canvas export to image file, image snapshot, interval selection, image rectangular filter, etc.
- Curve fitting tool with automatic fit, manual fit with sliders, ...
- Contrast adjustment panel for images: select the LUT by moving a range selection object on the image levels histogram, eliminate outliers, ...
- X-axis and Y-axis cross-sections: support for multiple images, average cross-section tool on a rectangular area, ...
- Apply any affine transform to displayed images in real-time (rotation, magnification, translation, horizontal/vertical flip, ...)
Application development helpers:
- Ready-to-use plot widgets and dialog boxes
- Load/save graphical objects (curves, images, shapes) into HDF5, JSON or INI files
- A lot of test scripts which demonstrate
plotpyfeatures (see examples)
Dependencies and installation
See Installation section in the documentation for more details.
Release history Release notifications | RSS feed


Download files
Download the file for your platform. If you're not sure which to choose, learn more about installing packages.
Source Distribution
Built Distributions
Hashes for PlotPy-2.5.1-cp312-cp312-win_amd64.whl
| Algorithm | Hash digest | |
|---|---|---|
| SHA256 | bf70d7995c3e031fe6e1c6ffff8e8e8c35ecdeba42b6b04e5c2c28ca42adb3a6 |
|
| MD5 | 1dfa0e3fd2bdc7f791ce29104c7c6948 |
|
| BLAKE2b-256 | 016e52e199487bc975c917e195bd74c42ce2de3874a78a9ce9d0e91a1fdc22c6 |
Hashes for PlotPy-2.5.1-cp312-cp312-manylinux_2_17_x86_64.manylinux2014_x86_64.manylinux_2_24_x86_64.whl
| Algorithm | Hash digest | |
|---|---|---|
| SHA256 | 7ceafec623756a0d3b51da5bb25f31af047799ca7ef9b9adf0fe055a2de3d697 |
|
| MD5 | 1fe6ebc1eb221073f9b5f1d81c8d1104 |
|
| BLAKE2b-256 | a9c89682e5ec44ca60f5e8bc819e7c97d2c986f842d4da6c0149d0fa37e30d3d |
Hashes for PlotPy-2.5.1-cp311-cp311-win_amd64.whl
| Algorithm | Hash digest | |
|---|---|---|
| SHA256 | 6c936638227ff5169e8cc24c4e327dbd0f28b94944d7920a0cf0a249bc2caed5 |
|
| MD5 | 9dca020aacab6eaf4e5d40a9c49ea833 |
|
| BLAKE2b-256 | 30942e5b3be23526df3d7237908d75209236623b95cd946d9f461b62fd827e06 |
Hashes for PlotPy-2.5.1-cp311-cp311-manylinux_2_24_x86_64.whl
| Algorithm | Hash digest | |
|---|---|---|
| SHA256 | 8fad979b6c9623138f659e7ae177c023046d6d849e1342f13b3c54f47ea03034 |
|
| MD5 | 5642437bf157734ad7a3e9bdb0aa33f8 |
|
| BLAKE2b-256 | 73777bada4aad768ae33f93bf1ff7b70985c9537187d5cc20a23f4cca317b36a |
Hashes for PlotPy-2.5.1-cp310-cp310-win_amd64.whl
| Algorithm | Hash digest | |
|---|---|---|
| SHA256 | 21f5debe0b0ea1a9521bcdc41659048fc478c362b945c933c74c4c5399cbb187 |
|
| MD5 | 2332756f564b6e87af9f66f86eee72c8 |
|
| BLAKE2b-256 | 9748739e5966ab7b0dbb640ecdc359cae3b334d8072672497f2a207cc3ffdf5b |
Hashes for PlotPy-2.5.1-cp310-cp310-manylinux_2_24_x86_64.whl
| Algorithm | Hash digest | |
|---|---|---|
| SHA256 | 908a65f63cf2c18ba6577d96bb44d45a38aa249e78863ed26555d083ff3ddf6d |
|
| MD5 | ced07285372d5157931885c6a0d3244e |
|
| BLAKE2b-256 | ae0f6d6c801944661c2924f66da1f3a3dff1dfd2a92312bd8b13ed822a1549d4 |
Hashes for PlotPy-2.5.1-cp39-cp39-win_amd64.whl
| Algorithm | Hash digest | |
|---|---|---|
| SHA256 | bbd0737019540db37fe968cd8db4dbc26d7b0d5e3fa3395903e40e5e52f56970 |
|
| MD5 | f3976c709f8d839e2a2dcc24c492e0d5 |
|
| BLAKE2b-256 | 5be6f5ce4c689b4ae591b52f372b3b774147fba26d77c241a02c33f7406663e8 |
Hashes for PlotPy-2.5.1-cp39-cp39-manylinux_2_24_x86_64.whl
| Algorithm | Hash digest | |
|---|---|---|
| SHA256 | af10634e3b77c8a617a59ef3003e01959912252d61e097a9c231d7f5e844b5fe |
|
| MD5 | 4b7a4d240005c587e9fe067395bbe289 |
|
| BLAKE2b-256 | 5bce6b9f1beae3db037f76d81f9af916d4b9f80e01a6cdfd810c376227d4d033 |
Hashes for PlotPy-2.5.1-cp38-cp38-win_amd64.whl
| Algorithm | Hash digest | |
|---|---|---|
| SHA256 | a70b9371ecc6637877565b4a30d5493a3651d06ebe4f1d20df3e76a6023d3276 |
|
| MD5 | 343ebe7996869846fa65f7e85eb6620a |
|
| BLAKE2b-256 | d9d8921a93b10e836ea0127f73a622f69648d3ce45edc2ee73958d9f9abdb604 |
Hashes for PlotPy-2.5.1-cp38-cp38-manylinux_2_24_x86_64.whl
| Algorithm | Hash digest | |
|---|---|---|
| SHA256 | 74f89e39841099a9a5808cbc07022c130a347016d68fb7242dab9477909ae7b8 |
|
| MD5 | ae6c96480bef3bb39a5e2f91302125da |
|
| BLAKE2b-256 | 6ab62c0a0ea0c53796afc647aee00644798ef28dc9d4db86bd3f1bfafa755e74 |


