Curve and image plotting tools for Python/Qt applications


Project description
PlotPy: Curve and image plotting tools for Python/Qt applications


ℹ️ Created in 2016 by Pierre Raybaut and maintained by the PlotPyStack organization.
ℹ️ PlotPy V2 is the new major release of guiqwt: same team 🏋️, same goal 🎯, same long-term support ⏳.
Overview
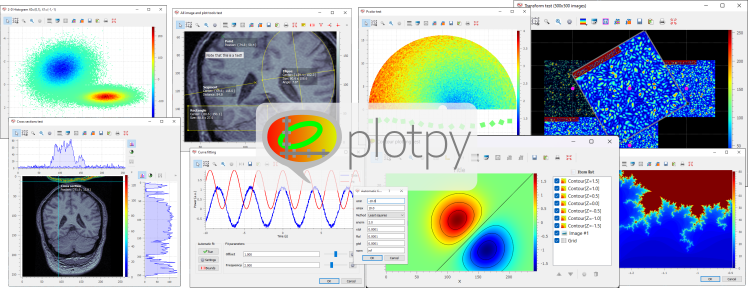
plotpy is is a Python library providing efficient 2D data-plotting features
for interactive computing and signal/image processing application development.
It is part of the PlotPyStack project, aiming at
providing a unified framework for creating scientific GUIs with Python and Qt.
plotpy is based on:
- Python language and Qt GUI toolkit (via PySide or PyQt)
- guidata automatic GUI generation library
- PythonQwt plotting widgets library
- NumPy and SciPy scientific computing libraries
See documentation for more details on the library and changelog for recent history of changes.
Copyrights and licensing:
- Copyright © 2023 CEA, Codra, Pierre Raybaut.
- Licensed under the terms of the BSD 3-Clause (see LICENSE).
Features
The plotpy library also provides the following features.
General plotting features:
- Ready-to-use plot widgets and dialog boxes
- pyplot: interactive
plotting widgets, equivalent to
matplotlib.pyplot, at least for the implemented functions - Supported plot items: curves, images, contours, histograms, labels, shapes, annotations, ...
Interactive features (i.e. not only programmatic plotting but also with mouse/keyboard):
- Multiple object selection for moving objects or editing their properties through automatically generated dialog boxes
- Item list panel: move objects from foreground to background, show/hide objects, remove objects, ...
- Customizable aspect ratio for images
- Tons of ready-to-use tools: plot canvas export to image file, image snapshot, interval selection, image rectangular filter, etc.
- Curve fitting tool with automatic fit, manual fit with sliders, ...
- Contrast adjustment panel for images: select the LUT by moving a range selection object on the image levels histogram, eliminate outliers, ...
- X-axis and Y-axis cross-sections: support for multiple images, average cross-section tool on a rectangular area, ...
- Apply any affine transform to displayed images in real-time (rotation, magnification, translation, horizontal/vertical flip, ...)
Application development helpers:
- Ready-to-use plot widgets and dialog boxes
- Load/save graphical objects (curves, images, shapes) into HDF5, JSON or INI files
- A lot of test scripts which demonstrate
plotpyfeatures (see examples)
Dependencies and installation
See Installation section in the documentation for more details.
Release history Release notifications | RSS feed


Download files
Download the file for your platform. If you're not sure which to choose, learn more about installing packages.
Source Distribution
Built Distributions
Hashes for PlotPy-2.6.1-cp312-cp312-win_amd64.whl
| Algorithm | Hash digest | |
|---|---|---|
| SHA256 | 8547ae3ccc0ef6e5b1173c8bd6306e0fd2dae29e2209efb3113e123cd4cdce8f |
|
| MD5 | 810f8a7a4d08a4a74056e814adf3cc99 |
|
| BLAKE2b-256 | 0e9b1ab0532990c3b31ea3bf1ee5b233ca69227cf9dcf10a11879640381f7cc3 |
Hashes for PlotPy-2.6.1-cp312-cp312-manylinux_2_17_x86_64.manylinux2014_x86_64.manylinux_2_24_x86_64.whl
| Algorithm | Hash digest | |
|---|---|---|
| SHA256 | 5f1e5da7d0ce22c8fe41c3aa5e152e37cecf7efec03e08ee2ca63e9817afd383 |
|
| MD5 | ba09327932b99e73ab941715601c607f |
|
| BLAKE2b-256 | 6db3939704072fbfaa8f1961e3df486dd80701119c6fbf503c779c0e4d0a5845 |
Hashes for PlotPy-2.6.1-cp311-cp311-win_amd64.whl
| Algorithm | Hash digest | |
|---|---|---|
| SHA256 | 233d979747e158d6a79f6fa63776f446aec0c55ea1387332dbc4955124bd06e7 |
|
| MD5 | fd5e9dd6aba6bc2e63974640213c1235 |
|
| BLAKE2b-256 | a348700c827dd02bb7eb1c331ba1e4cc6968ef2cbebfd58319a5f4bbcb18e3a6 |
Hashes for PlotPy-2.6.1-cp311-cp311-manylinux_2_24_x86_64.whl
| Algorithm | Hash digest | |
|---|---|---|
| SHA256 | db0be22a5ea29e5aa0ff7863429269df6fe1ecdd54b6d747800350226da2987d |
|
| MD5 | 7898a47ba9e01c0826bec0105fa060a1 |
|
| BLAKE2b-256 | 3b1623594f49ca3c07ea6a69388aeacbb7ed0bfddbf75ee3bc6c57e772c69528 |
Hashes for PlotPy-2.6.1-cp310-cp310-win_amd64.whl
| Algorithm | Hash digest | |
|---|---|---|
| SHA256 | f6e8e29915a5a2b1862c313827252a209551ac04538b14b0d4e0465867aa2e71 |
|
| MD5 | a606a98c08b23a2819897828b88cac21 |
|
| BLAKE2b-256 | 11f02192d773e782b27b76bae7278f28ec780b6894183183cfcc2aef5ad06c2e |
Hashes for PlotPy-2.6.1-cp310-cp310-win32.whl
| Algorithm | Hash digest | |
|---|---|---|
| SHA256 | eb685840e85334149a99ebed7fd562e696b13e3f3220e2d0a98254c4da4a6bd3 |
|
| MD5 | 4f51aecbd45dc5b22bc5f3cde28ebfb6 |
|
| BLAKE2b-256 | 852207e4cd83fb127a3ddb6b8b796d396c1b362952cf6d3b7b21ab255c832912 |
Hashes for PlotPy-2.6.1-cp310-cp310-manylinux_2_24_x86_64.whl
| Algorithm | Hash digest | |
|---|---|---|
| SHA256 | b091c1c2627e892c8d705a6eb3e4035cfefea495acf8f407db33e935664b5f99 |
|
| MD5 | 4009d4a73d870c33a5f45433b7c3ee93 |
|
| BLAKE2b-256 | b0746392a71d71d1843dfd435687401fe2b92465d43e027aa474c3a38fa55a17 |
Hashes for PlotPy-2.6.1-cp310-cp310-manylinux_2_5_x86_64.manylinux1_x86_64.manylinux_2_17_x86_64.manylinux2014_x86_64.whl
| Algorithm | Hash digest | |
|---|---|---|
| SHA256 | 1c64399aabe8453d851929756a73a1cccef0d7f16d7c57835fef1d51486b5b79 |
|
| MD5 | be3f71c715a46217f9090bfd311dc36f |
|
| BLAKE2b-256 | 9fcc3031372c8dc1516aee96fcb1c5eb90cf2c84f40969edd2163b0a3782269a |
Hashes for PlotPy-2.6.1-cp310-cp310-macosx_11_0_arm64.whl
| Algorithm | Hash digest | |
|---|---|---|
| SHA256 | d69f95d2407db5da8c982a8ce02a1bb8c15cba7f9b7117b5ce81219185dbb976 |
|
| MD5 | 6bc645c939d31cf17193289ab26ccef4 |
|
| BLAKE2b-256 | e5fe49345344238ff6a54d6b7d5f7fffe3e357f0c332cea946034bd5b802e06e |
Hashes for PlotPy-2.6.1-cp310-cp310-macosx_10_9_x86_64.whl
| Algorithm | Hash digest | |
|---|---|---|
| SHA256 | 9701af5fa75f16c1f9196dcb794ef241310404e104d438ce421172168909574d |
|
| MD5 | b77a9faa3d58800a1748fa171df32c4b |
|
| BLAKE2b-256 | 6c9615d191a444547daec6e2faf5f814954fecd7ee7005ed35445e9fce378322 |
Hashes for PlotPy-2.6.1-cp39-cp39-win_amd64.whl
| Algorithm | Hash digest | |
|---|---|---|
| SHA256 | 081e3e82b6a5aedb7ef12726452336aa74b197903e304a5791823278d835c72d |
|
| MD5 | 05c988b3869fd5c39752ac719503c298 |
|
| BLAKE2b-256 | 41819fd41e2474fff73c3e26401e3861b540b29a69479880563a1b6f461a05ef |
Hashes for PlotPy-2.6.1-cp39-cp39-manylinux_2_24_x86_64.whl
| Algorithm | Hash digest | |
|---|---|---|
| SHA256 | 86721ae7b6949e7a63a69aa6daa61def61d2d4ad0cdf9c8fab90ed3cedff51ec |
|
| MD5 | 7beebfeb0a34fc5e3b90b62a4a22fec7 |
|
| BLAKE2b-256 | a697a34d444f6daf9283c72d3484ad0facfbdaaa0645330fa25012de2094eeed |
Hashes for PlotPy-2.6.1-cp38-cp38-win_amd64.whl
| Algorithm | Hash digest | |
|---|---|---|
| SHA256 | f50db5bbc82e2e6790bdda0f881b41a085ff153b29be46d0db86a285c27324ba |
|
| MD5 | ba60f197ab2fadd314fde081973eee0d |
|
| BLAKE2b-256 | 0748d180b81c0b784964493327c3b3709cdbfe348c5d569f01f8db7bb5e738c1 |
Hashes for PlotPy-2.6.1-cp38-cp38-manylinux_2_24_x86_64.whl
| Algorithm | Hash digest | |
|---|---|---|
| SHA256 | 1cebb8bf7418b25c37903057ce4402cc098356c43f1430856112f695773a603a |
|
| MD5 | 2eb61f663ab04f9aa492fb51e1431f9a |
|
| BLAKE2b-256 | c498c43067690f9466f3a2316883a78f766f629217aede9183632a17286e542a |


