Python library to make plotting simpler for data scientists
Project description
Chartify is a Python library that makes it easy for data scientists to create charts.
Why use Chartify?
Consistent input data format: Spend less time transforming data to get your charts to work. All plotting functions use a consistent tidy input data format.
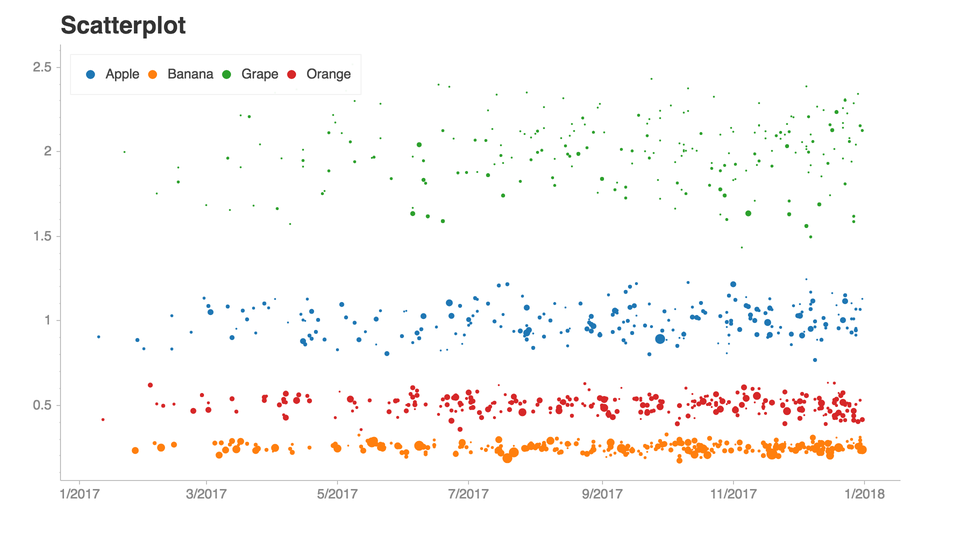
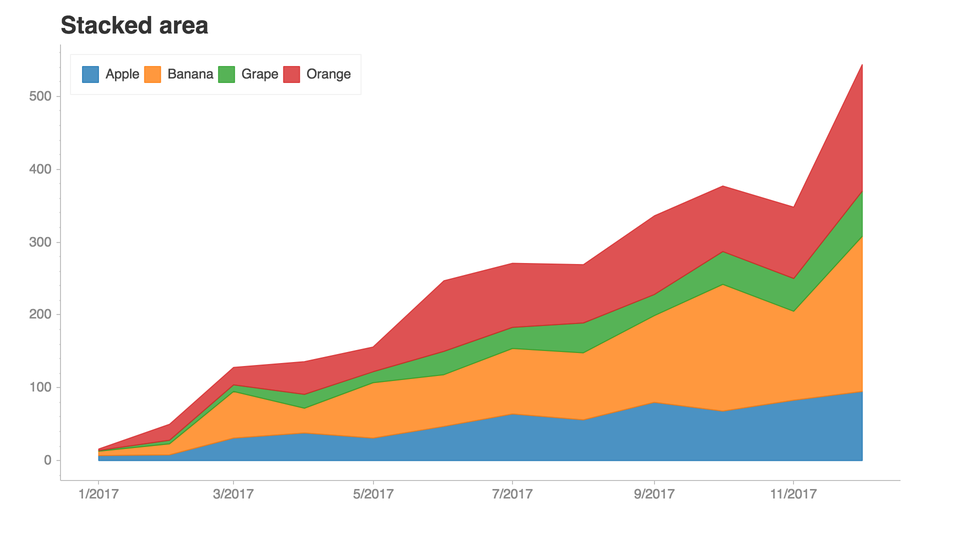
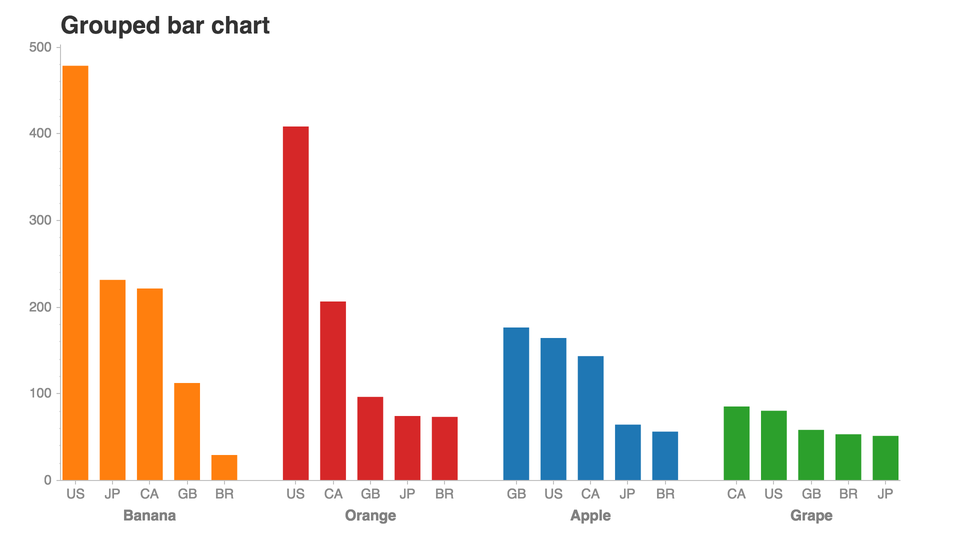
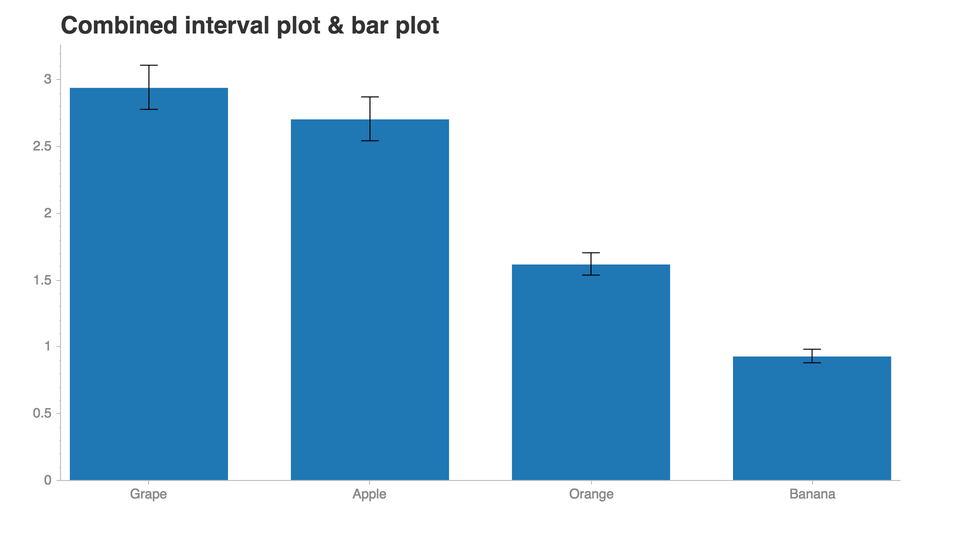
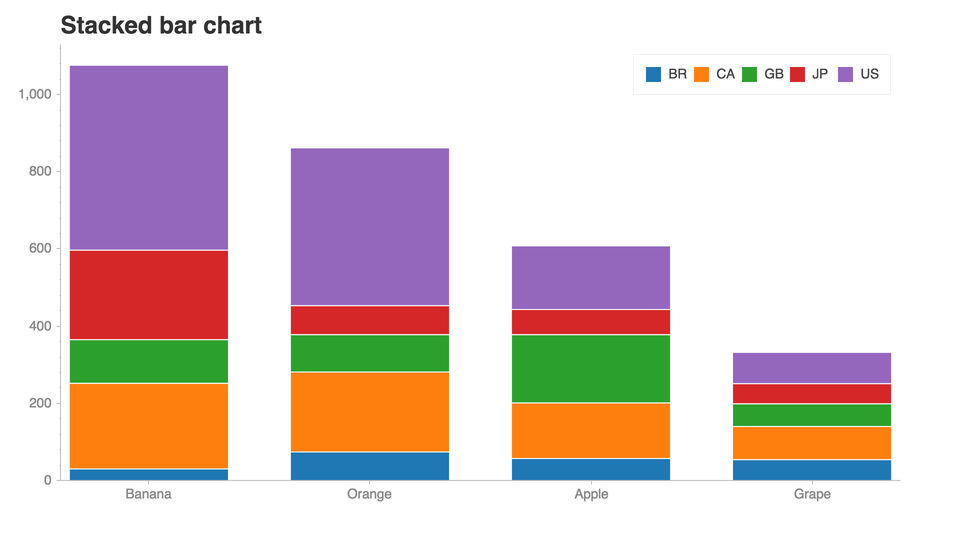
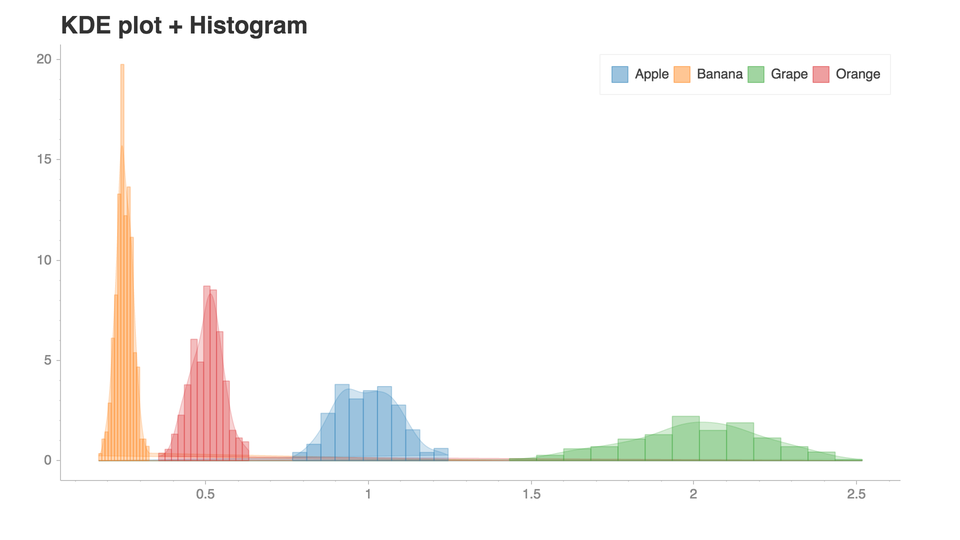
Smart default styles: Create pretty charts with very little customization required.
Simple API: We’ve attempted to make the API as intuitive and easy to learn as possible.
Flexibility: Chartify is built on top of Bokeh, so if you do need more control you can always fall back on Bokeh’s API.
Examples
Installation
Chartify can be installed via pip:
pip3 install chartify
- Install chromedriver requirement (Optional. Needed for PNG output):
Install google chrome.
Download the appropriate version of chromedriver for your OS here.
- Copy the executable file to a directory within your PATH.
View directorys in your PATH variable: echo $PATH
Copy chromedriver to the appropriate directory, e.g.: cp chromedriver /usr/local/bin
Getting started
This tutorial notebook is the best place to get started with a guided tour of the core concepts of Chartify.
From there, check out the example notebook for a list of all the available plots.
Docs
Documentation available on chartify.readthedocs.io
Getting support
Join #chartify on spotify-foss.slack.com (Get an invite)
Use the chartify tag on StackOverflow.
Resources
Data Visualization with Chartify
Code of Conduct
This project adheres to the Open Code of Conduct. By participating, you are expected to honor this code.
Contributing
History
4.0.2 (2023-03-30)
Fix categorical_order_by check for scatter plot
Fix categorical_order_by check for _construct_source
Refactor category sorting in _construct_source
Add tests for categorical_order_by
Fix scatter plot tests that used line plots
4.0.1 (2023-03-24)
Updated version requirement of pillow to avoid bug
4.0.0 (2023-03-23)
Dropped support for python 3.6 and 3.7
3.1.0 (2023-03-22)
Added Boxplot Chart including example in examples notebook
3.0.5 (2022-12-13)
Fixed a few errors in example and tutorial notebooks
Fixed a typo in requirements.txt
3.0.4 (2022-10-18)
Updated package requirements
Got rid of future deprecation warnings
Bugfix related to legend for graphs with multiple groups and colors
3.0.2 (2020-10-21)
Support pyyaml 5.2+
3.0.1 (2020-06-02)
Reduce dependencies by switching from Jupyter to IPython.
3.0.0 (2020-05-29)
Updated Python to 3.6+ and Pandas to 1.0+ (Thanks @tomasaschan!)
Updated Bokeh to 2.0+
Removed colour dependency to fix setup errors.
2.7.0 (2019-11-27)
Bugfixes:
Updated default yaml loader to move off of deprecated method (Thanks @vh920!)
Updated legend handling to adjust for deprecated methods in recent versions of Bokeh (Thanks for reporting @jpkoc)
Updated license in setup.py (Thanks for reporting @jsignell)
Bump base Pillow dependency to avoid insecure version.
Update MANIFEST to include missing files (Thanks @toddrme2178!)
2.6.1 (2019-08-15)
Bugfixes:
Moved package requirements and fixed bug that occured with latest version of Bokeh (Thanks @emschuch & @mollymzhu!)
Fixed bug in README while generating docs (Thanks @Bharat123rox!)
2.6.0 (2019-03-08)
Improvements:
Allows users to plot colors on bar charts that aren’t contained in the categorical axis.
Bugfixes:
Fixed bug that caused float types to break when plotted with categorical text plots (Thanks for finding @danela!)
Fixed broken readme links.
2.5.0 (2019-02-17)
Improvements:
Added Radar Chart
2.4.0 (2019-02-16)
Improvements:
Added second Y axis plotting.
Removed Bokeh loading notification on import (Thanks @canavandl!)
Added support for custom Bokeh resource loading (Thanks @canavandl!)
Added example for Chart.save() method (Thanks @david30907d!)
Bugfixes:
Updated documentation for saving and showing svgs.
Fixed bug that broke plots with no difference between min and max points. (Thanks for finding @fabioconcina!)
2.3.5 (2018-11-21)
Improvements:
Updated docstrings (Thanks @gregorybchris @ItsPugle!)
Added SVG output options to Chart.show() and Chart.save() (Thanks for the suggestion @jdmendoza!)
Bugfixes:
Fixed bug that caused source label to overlap with xaxis labels.
Fixed bug that prevented x axis orientation changes with datetime axes (Thanks for finding @simonwongwong!)
Fixed bug that caused subtitle to disappear with outside_top legend location (Thanks for finding @simonwongwong!)
Line segment callout properties will work correctly. (Thanks @gregorybchris!)
2.3.4 (2018-11-13)
Updated Bokeh version requirements to support 1.0
2.3.3 (2018-10-24)
Removed upper bound of Pillow dependency.
2.3.2 (2018-10-18)
Stacked bar and area order now matches default vertical legend order.
Added method for shifting color palettes.
Added scatter plots with a single categorical axis.
Fixed bug with text_stacked that occurred with multiple categorical levels.
2.3.1 (2018-09-27)
Fix scatter plot bug that can occur due to nested data types.
2.3.0 (2018-09-26)
Added hexbin plot type.
More control over grouped axis label orientation.
Added alpha control to scatter, line, and parallel plots.
Added control over marker style to scatter plot.
Added ability to create custom color palettes.
Changed default accent color.
Visual tweaks to lollipop plot.
Bar plots with a few number of series will have better widths.
2.2.0 (2018-09-17)
First release on PyPI.
Project details
Release history Release notifications | RSS feed
Download files
Download the file for your platform. If you're not sure which to choose, learn more about installing packages.
Source Distribution
Built Distribution
File details
Details for the file chartify-4.0.2.tar.gz.
File metadata
- Download URL: chartify-4.0.2.tar.gz
- Upload date:
- Size: 4.2 MB
- Tags: Source
- Uploaded using Trusted Publishing? No
- Uploaded via: twine/4.0.1 CPython/3.11.2
File hashes
| Algorithm | Hash digest | |
|---|---|---|
| SHA256 | d19c9c2f9fd60a7cde22b9fa8405024a3c4d3d135a21dcd78f6bbd285148e3e2 |
|
| MD5 | f3d2f77554474b1abbab0e61fcafacc9 |
|
| BLAKE2b-256 | 7353891f43c1c30889954834a4e66a03541e50607f188725b24002f85dda84f4 |
File details
Details for the file chartify-4.0.2-py2.py3-none-any.whl.
File metadata
- Download URL: chartify-4.0.2-py2.py3-none-any.whl
- Upload date:
- Size: 63.9 kB
- Tags: Python 2, Python 3
- Uploaded using Trusted Publishing? No
- Uploaded via: twine/4.0.1 CPython/3.11.2
File hashes
| Algorithm | Hash digest | |
|---|---|---|
| SHA256 | 7587e6409fd1ee10a7ad7cdf1b214303c6cf9fc399610fe06541a7507f655d7f |
|
| MD5 | dfdf42abac31b49025bc6c93297e0b6b |
|
| BLAKE2b-256 | e7e48dc76c3a1d47e3c11b75784649f6845417a2ff78267f403d0cd65b66e580 |


