A data logger specializing in reading an array of DS18B20 sensors.

Project description
ds18b20-datalogger
A data logger specializing in reading an array of DS18B20 sensors.
A temperature sensor matrix with heatmap visualization for bee hive monitoring, using Raspberry Pi, Python, DS18B20, MQTT, Kotori DAQ, and Grafana.
| View from outside | View from inside (sensor tip details) |
|---|---|
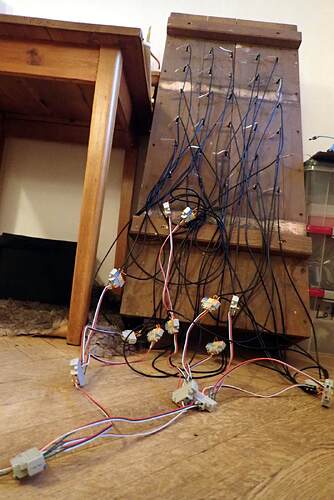 |
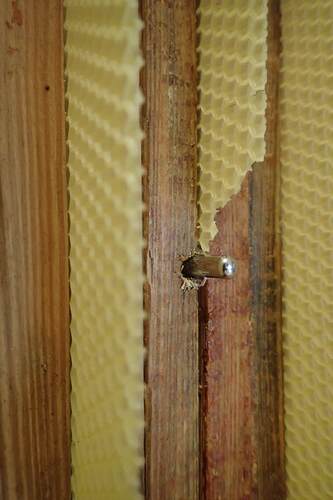 |
Lab protocol and development details: https://community.hiveeyes.org/t/laborprotokoll-4x5-temp-matrix-mit-ds18b20/5102
Project Information
» Documentation | Changelog | PyPI | Issues | Source code | License


What's Inside
- The
ds18b20-dataloggerprogram, reading DS18B20 sensors and publishing readings to MQTT. - JSON representation for a corresponding Grafana Dashboard, when acquired through Kotori DAQ.
Setup
We recommend to install the program into a Python virtualenv.
python3 -m venv .venv
source .venv/bin/activate
pip install 'ds18b20-datalogger @ git+https://github.com/hiveeyes/ds18b20-datalogger.git'
In this spirit, you keep the installation separate from your system Python, so you can easily nuke it and start from scratch in case anything goes south.
Prerequisites: This program needs the paho-mqtt package.
https://pypi-hypernode.com/project/paho-mqtt/#installation
Operations
Sensor Wiring
Be aware that you might have to adjust your resistors size. With 30 sensors i had erratic sensor mapping using a 4.7k resistor. I am getting valid mapping using a 2.2k resistor.
Sensor Mapping
https://community.hiveeyes.org/t/ds18b20-temperatur-sensoren-am-one-wire-bus-anordnen/1399
Data Publishing
ssh youruser@yourpi
screen
source /path/to/ds18b20-datalogger/.venv/bin/activate
ds18b20-datalogger
MQTT data upload to Hiveeyes
Format your array
https://community.hiveeyes.org/t/how-to-visualize-2-dimensional-temperature-data-in-grafana/974/9
matrix = [[temp_ir_1_1, temp_ir_1_2, temp_ir_1_3, temp_ir_1_4, temp_ir_1_5, temp_ir_1_6],
          [temp_ir_2_1, temp_ir_2_2, temp_ir_2_3, temp_ir_2_4, temp_ir_2_5, temp_ir_2_6],
          [temp_ir_3_1, temp_ir_3_2, temp_ir_3_3, temp_ir_3_4, temp_ir_3_5, temp_ir_3_6],
          [temp_ir_4_1, temp_ir_4_2, temp_ir_4_3, temp_ir_4_4, temp_ir_4_5, temp_ir_4_6],
          [temp_ir_5_1, temp_ir_5_2, temp_ir_5_3, temp_ir_5_4, temp_ir_5_5, temp_ir_5_6]]
Data visualization in Grafana
https://swarm.hiveeyes.org/grafana/d/Y9PcgE4Sz/mois-ex-wtf-test-ir-sensor-svg-pixmap-copy
Bonus: Sensor offsets
https://community.hiveeyes.org/t/temperatursensoren-justieren-kalibrieren/1744/2
Cron Configuration
*/5 * * * * cd /path/to/data-directory && /path/to/ds18b20-datalogger/.venv/bin/ds18b20-datalogger
Contributing
In order to learn how to start hacking on this program, please have a look at the documentation about how to install a development sandbox.
Contributions of any kind are always welcome and appreciated. Thank you.
Release history Release notifications | RSS feed


Download files
Download the file for your platform. If you're not sure which to choose, learn more about installing packages.
Source Distribution
Built Distribution
Hashes for ds18b20_datalogger-0.0.2-py3-none-any.whl
| Algorithm | Hash digest | |
|---|---|---|
| SHA256 | 8773d1da39efee9e064f40dd0cb611dfc8dda2d7547acb6111aee535b145335e |
|
| MD5 | 2976fb78a0158d90f1d900e1142882d0 |
|
| BLAKE2b-256 | 0d5c956a3f5ae2ca02592731a2d638efcf970ec8265839daca3a4defc3868d8a |


