browser-based gdb frontend using Flask and JavaScript to visually debug C, C++, Go, or Rust
Project description
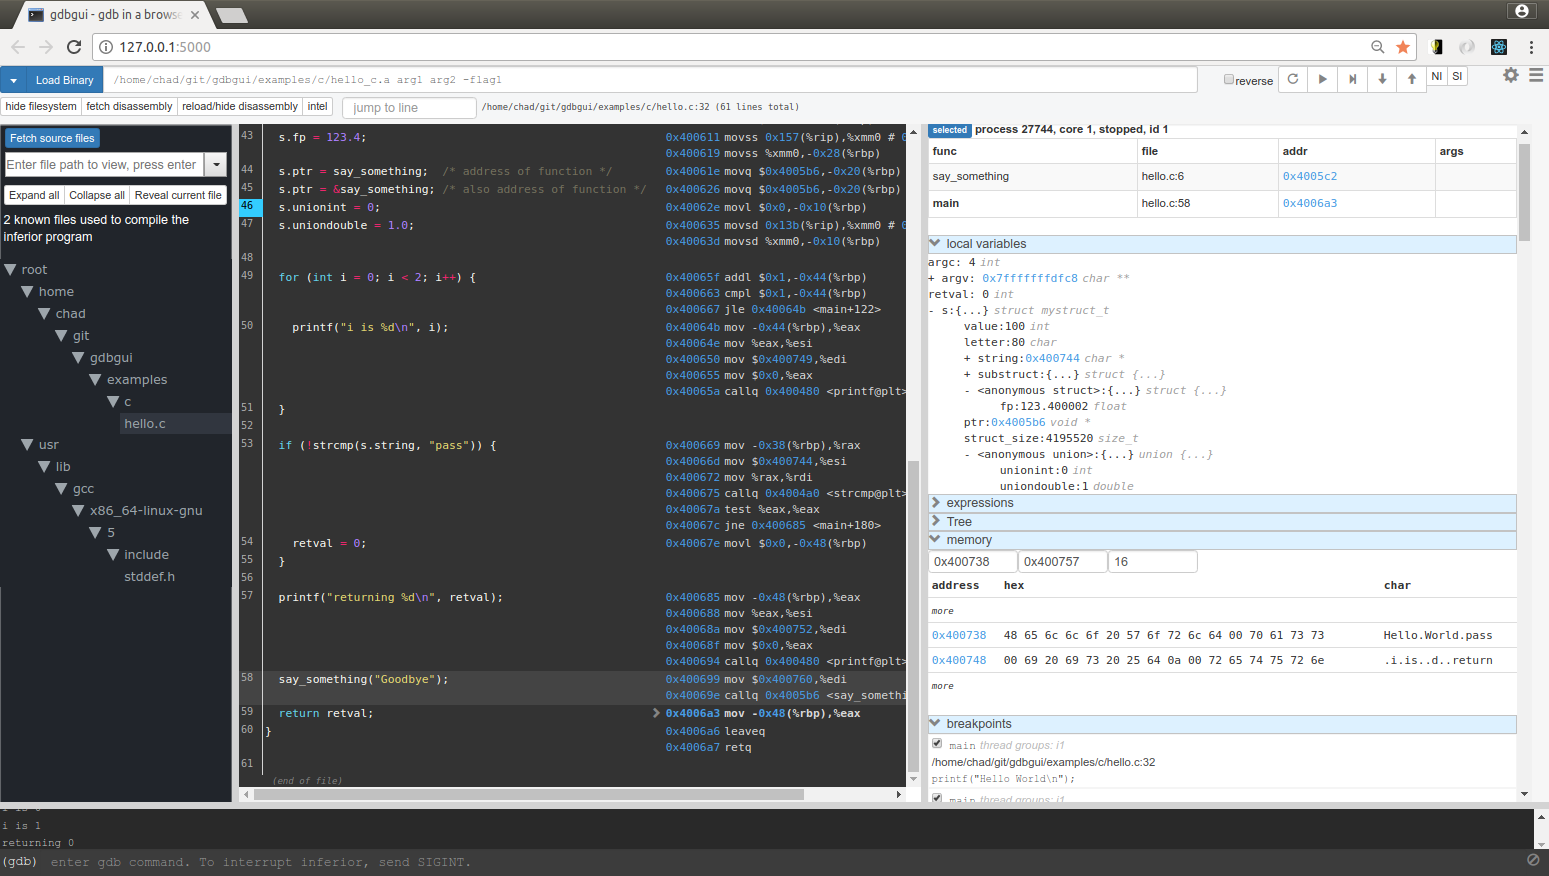


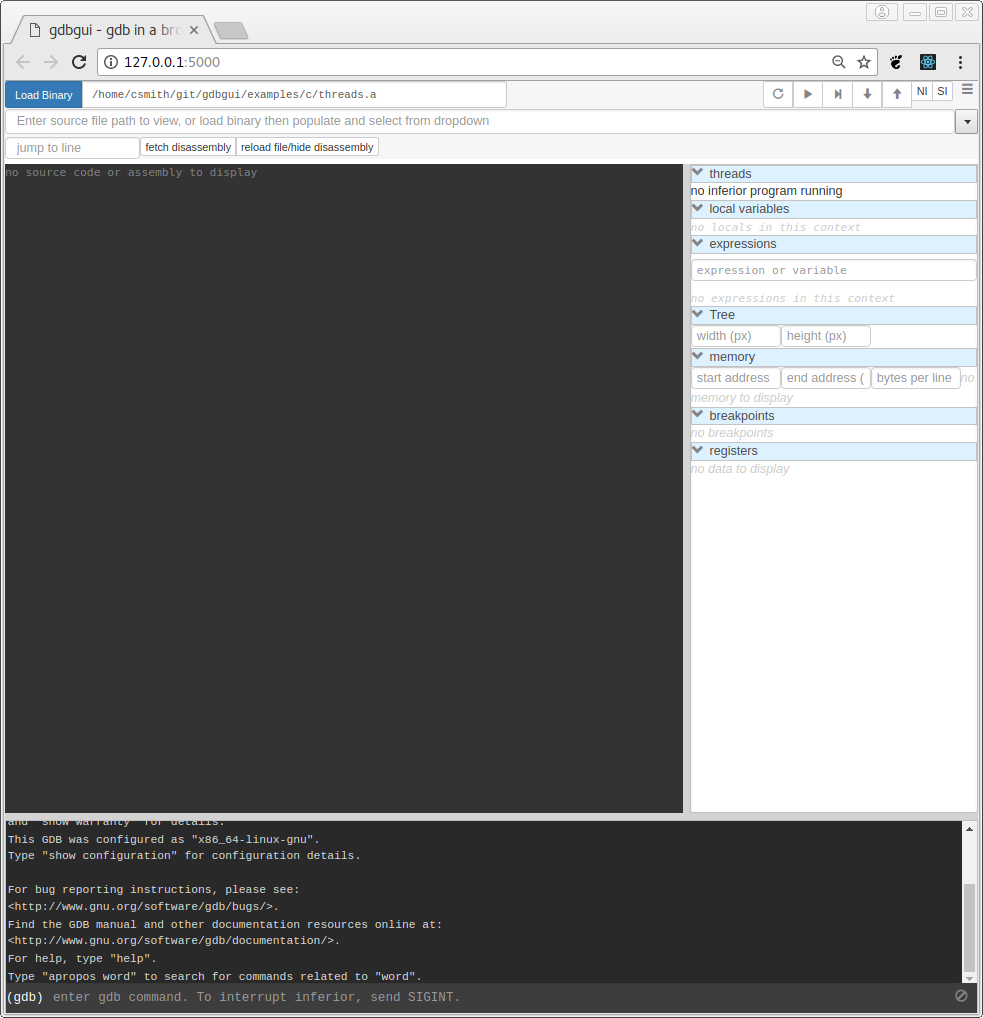
A modern, browser-based frontend to gdb (gnu debugger). Add breakpoints, view stack traces, and more in C, C++, Go, and Rust! Simply run gdbgui from the terminal and a new tab will open in your browser. Screenshots are below.
Install
Linux
sudo pip install gdbgui --upgrade
macOS
sudo pip install gdbgui --upgrade --user
Follow these instructions to codesign gdb if you get an error such as please check gdb is codesigned - see taskgated(8)
Windows
Tested with cygwin.
pip install gdbgui --upgrade
virtualenv users do not need the sudo prefix.
If you get fatal error: Python.h: No such file or directory, install `python-dev. If using apt-get, sudo apt-get install python3-dev for python3, or sudo apt-get install python-dev for python2.
Alternatively, you can clone and run directly
git clone https://github.com/cs01/gdbgui
cd gdbgui
pip install -r requirements.txt
gdbgui/backend.py
Run
gdbgui [-h] [-p PORT] [--host HOST] [-r] [-g GDB] [--lldb] [-v]
          [--hide_gdbgui_upgrades] [--debug] [-n]
          [cmd [cmd ...]]
A new tab in your browser will open with gdbgui in it.
Features
Debug a different program in each tab (new gdb instance is spawned for each tab)
Set/remove breakpoints
View stack, threads
Switch frame on stack, switch between threads
Intuitively explore local variables when paused
Hover over variables in source code to view contents
Evaluate arbitrary expressions and plot their values over time
Inspect memory in hex/character form
View all registers
Dropdown of all files used to compile binary, with autocomplete functionality
Source code explorer with ability to jump to line
Show assembly next to source code, highlighting current instruction. Can also step through instructions.
Notifications when new updates are available
Why gdbgui?
Actively developed to be compatible with current gdb releases
Does only one thing: debugs programs. No integrated build system, no project settings, nothing to make things more complicated than they need to be.
Design influenced by the amazing Chrome debugger
Full gdb command line utility built-in
Written in widely used languages (Python and JavaScript)
Open source and free
Examples
Example code and makefiles for C, C++, go, and rust, that build and launch gdb.
See the examples folder.
Arguments
- Positional arguments:
command: (Optional) The executable and arguments to run in gdb. This is a way to script the intial loading of the inferior program you wish to debug. For example gdbgui "./mybinary -myarg -flag1 -flag2" (note the quotes around the executable and arguments). Executables and arguments can also be input through the browser interface after launching (no quotes required there).
- Flags (all are optional):
- -h, --help
show this help message and exit
- -p PORT, --port PORT
The port on which gdbgui will be hosted
- --host HOST
The host ip address on which gdbgui serve.
- -r, --remote
Shortcut to sets host to 0.0.0.0 and suppress browser from opening. This allows remote access to gdbgui and is useful when running on a remote machine that you want to view/debug from your local browser, or let someone else debug your application remotely.
- -g GDB, --gdb GDB
Path to gdb executable or lldb-mi executable. Defaults is ‘gdb’. lldb support is experimental and not fully functional at this time.
- -v, --version
Print gdbgui version
- --debug
The debug flag of gdbgui. Pass this flag when debugging gdbgui itself to automatically reload the server when changes are detected.
- -n, --no_browser
By default, the browser will open with gdb gui. Pass this flag so the browser does not open.
Compatibility
Python versions: 2.7, 3.4, 3.5, 3.6, 3.6-dev, 3.7-dev, pypy
Operating systems: Ubuntu 14.04+, OSX
Browsers: Chrome
Gdb: 7.7.1 - 8
Rust users: gdb v7.12.x cannot display register values due to a gdb bug
Settings
gdbgui settings can be accessed by clicking the gear icon in the top right of the frontend. Most of these settings persist between sessions for the url and port.
Keyboard Shortcuts
The following keyboard shortcuts are available when the focus is not in an input field. They have the same effect as when the button is pressed.
Run: r
Continue: c
Next: n or right arrow
Step: s or down arrow
Up: u or up arrow
Next Instruction: m
Step Instruction: ,
Contributing
Help the gdbgui project grow by spreading the word.

Creating and voting on issues in github will help me prioritize what to work on.
Documentation, spelling fixes, bug fixes, features, etc. are of course welcome too. To get started with development, set up a new virtual environment, then run
git clone https://github.com/cs01/gdbgui
cd gdbgui
pip install -r requirements.txt
pip install -r dev_requirements.txt
gdbgui/backend.py --debug
If you are modifying gdbgui.js, make sure you have the developer console open so the browser doesn’t cache the file and miss your changes. When --debug is passed, there is a new component at the bottom of the right sidebar that displays the raw gdb mi output to help you debug.
Testing
make test runs unit tests and verifies README.rst is properly formatted. gdbgui/tests/test_app.py. Add new tests there as necessary.
License
GNU GPLv3
pyPI and this github page are the only official sources of gdbgui.
How Does it Work?
The pygdbmi library manages gdb as a subprocess, and returns key/value pairs (dictionaries).
The Flask-SocketIO server (Flask+websockets) serves the webpage and provides realtime interactivity. http/websocket endpoints are available for the browser. Each websocket connection (browser tab) runs a pygdbmi-managed instance of gdb. A thread is spawned constantly read and forward output from gdb to the browser.
The pypugjs template engine is used to reduce html LOC
The browser manages its ui and state with the plain JavaScript library stator
gdbgui was designed to be easily hackable and extendable. There is no build system necessary to run or develop this app.
The main components of gdbgui are
backend.py: The backend consists of a single Python file, which makes use of pygdbmi to interact with a gdb subprocess, and Flask to set up url routing, websockets, and http responses.
gdbgui.pug: HTML file that defines the frontend
gdbgui.js: The majority of the application is contained in this file. It dynamically updates the page, and maintains gdb state. It sends AJAX requests and uses websockets to interact with gdb through the server, then gets the response and updates the DOM as necessary.
gdbgui.css: css stylesheet
Screenshots
Enter the binary and args just as you’d call them on the command line. Binary is restored when gdbgui is opened at a later time.

Intuitive control of your program. From left to right: Run, Continue, Next, Step, Return, Next Instruction, Step Instruction, send interrupt signal (SIGINT) to inferior process.

Stack/Threads
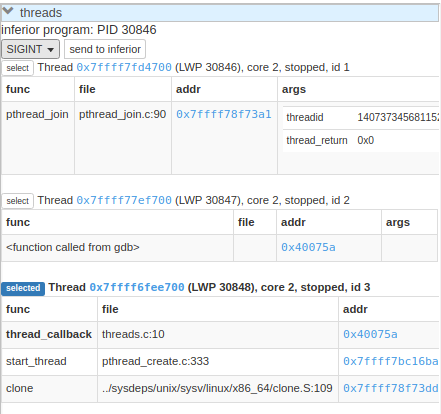
View all threads, the full stack on the active thread, the current frame on inactive threads. Switch between frames on the stack, or threads by pointing and clicking.
Source Code
View source, assembly, add breakpoints. All symbols used to compile the target are listed in a dropdown above the source code viewer, and have autocompletion capabilities.

With assembly. Note the bold line is the current instruction that gdb is stopped on.

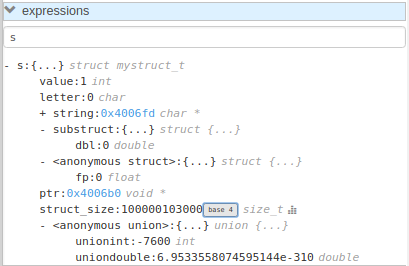
Variables and Expressions
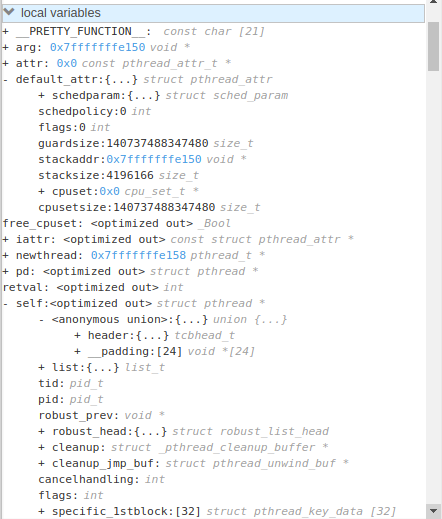
All local variables are automatically displayed, and are clickable to explore their fields.
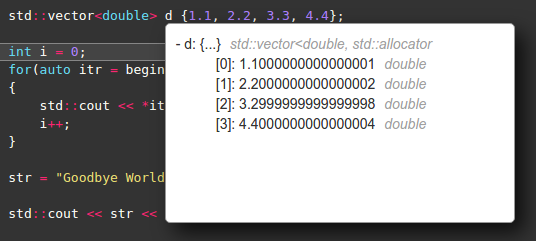
Hover over a variable and explore it, just like in the Chrome debugger.
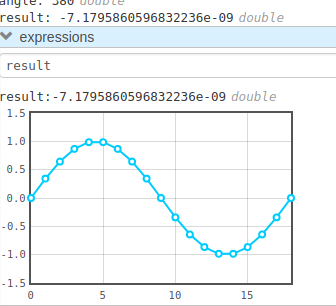
Arbitrary expressions can be evaluated as well.
Expressions record their previous values, and can be displayed in an x/y plot.
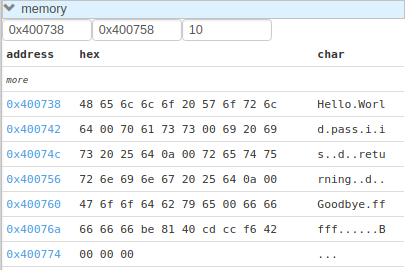
Memory Viewer
All hex addresses are automatically converted to clickable links to explore memory. Length of memory is configurable. In this case 16 bytes are displayed per row.
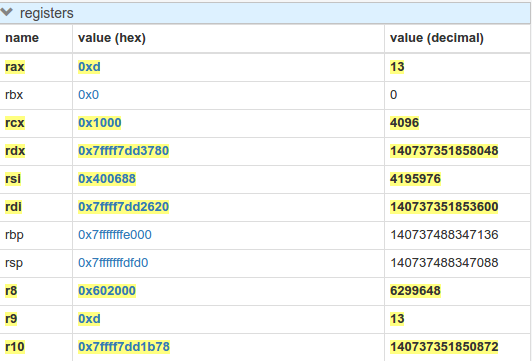
Registers
View all registers. If a register was updated it is highlighted in yellow.
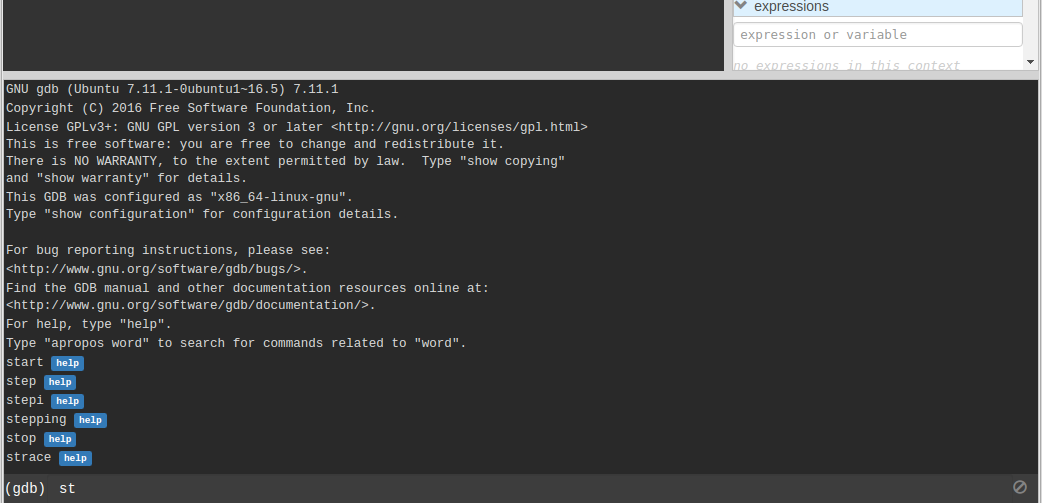
gdb console
Read gdb output, and write to the gdb subprocess as desired. Don’t let any gdb commandline skills you’ve developed go to waste.
gdbgui at launch:
Contact
Project details
Release history Release notifications | RSS feed
Download files
Download the file for your platform. If you're not sure which to choose, learn more about installing packages.
Source Distribution
File details
Details for the file gdbgui-0.7.7.0.tar.gz.
File metadata
- Download URL: gdbgui-0.7.7.0.tar.gz
- Upload date:
- Size: 269.9 kB
- Tags: Source
- Uploaded using Trusted Publishing? No
File hashes
| Algorithm | Hash digest | |
|---|---|---|
| SHA256 | 57cd648d006004170e8ae4cb3c1246cb2a1ea7a7325fb24254b0481df27dc05f |
|
| MD5 | cfb416a76d88415bd84069a931a85787 |
|
| BLAKE2b-256 | 48755a87c2d182a5de295d1f7538d073f65e9448cbfa5a1729312a5e60e0dd73 |


