Animate timeseries data with Grafana
Project description


grafanimate
Animate timeseries data with Grafana.
About
grafanimate captures screenshots while animating a Grafana dashboard by manipulating its time range control, i.e. navigating through time. The result can be rendered as a sequence of png images, an animated gif file and as a video file.
Examples
Composition: The Hiveeyes Project. Developing a flexible beehive monitoring infrastructure. Clicking on an image will take you to the animated version.
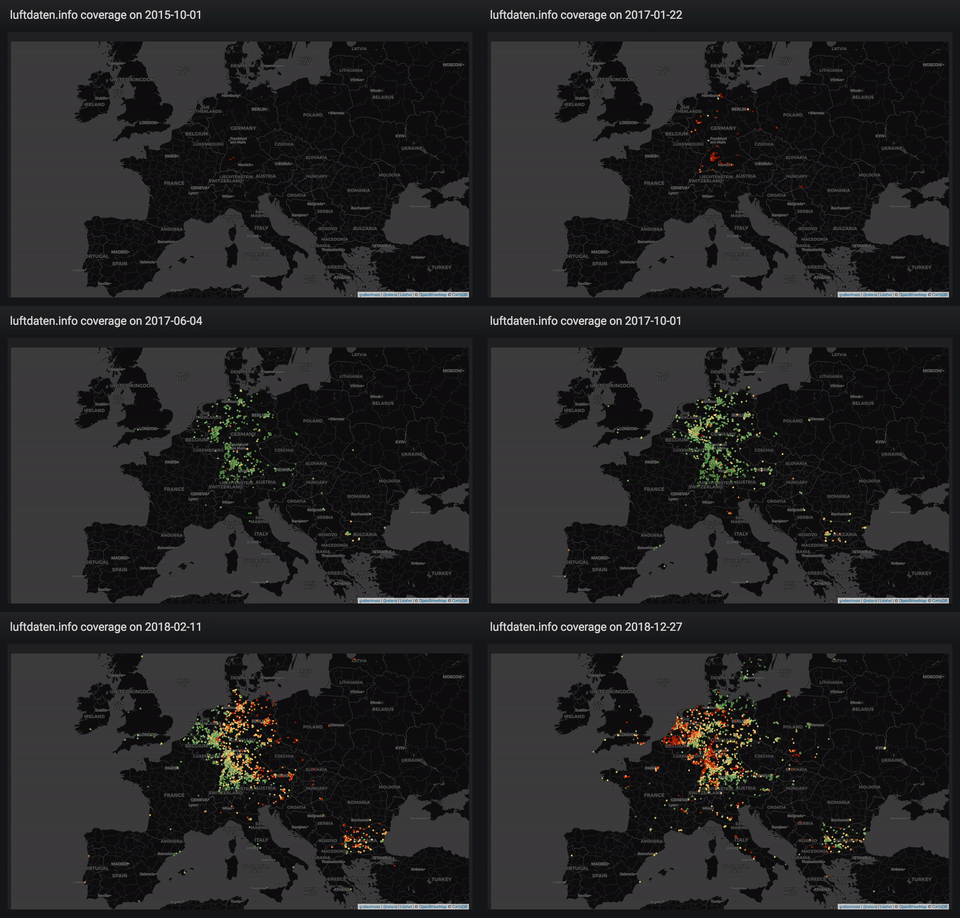
luftdaten.info coverage

Coverage of luftdaten.info sensors starting October 2015 across Europe.
Data source: luftdaten.info (LDI)
Production: Luftdatenpumpe, LDI data plane v2, daily.
Development: Erneuerung der Luftdatenpumpe. All contributions welcome.
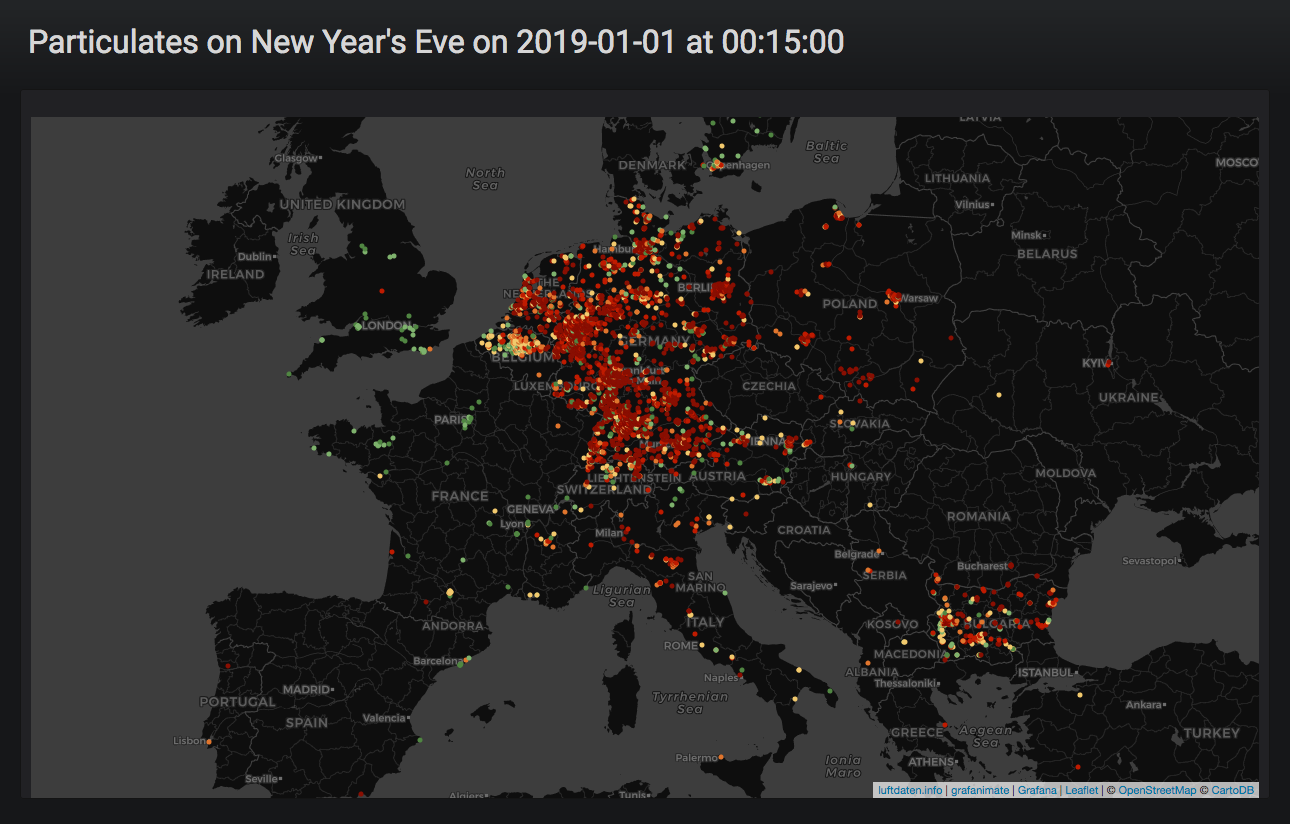
Fine dust pollution on New Year’s Eve

Animation of fine dust pollution on New Year’s Eve 2018 across Europe.
Data source: luftdaten.info (LDI)
Production: Luftdatenpumpe, LDI data plane v2, historical.
Development: Erneuerung der Luftdatenpumpe. All contributions welcome.
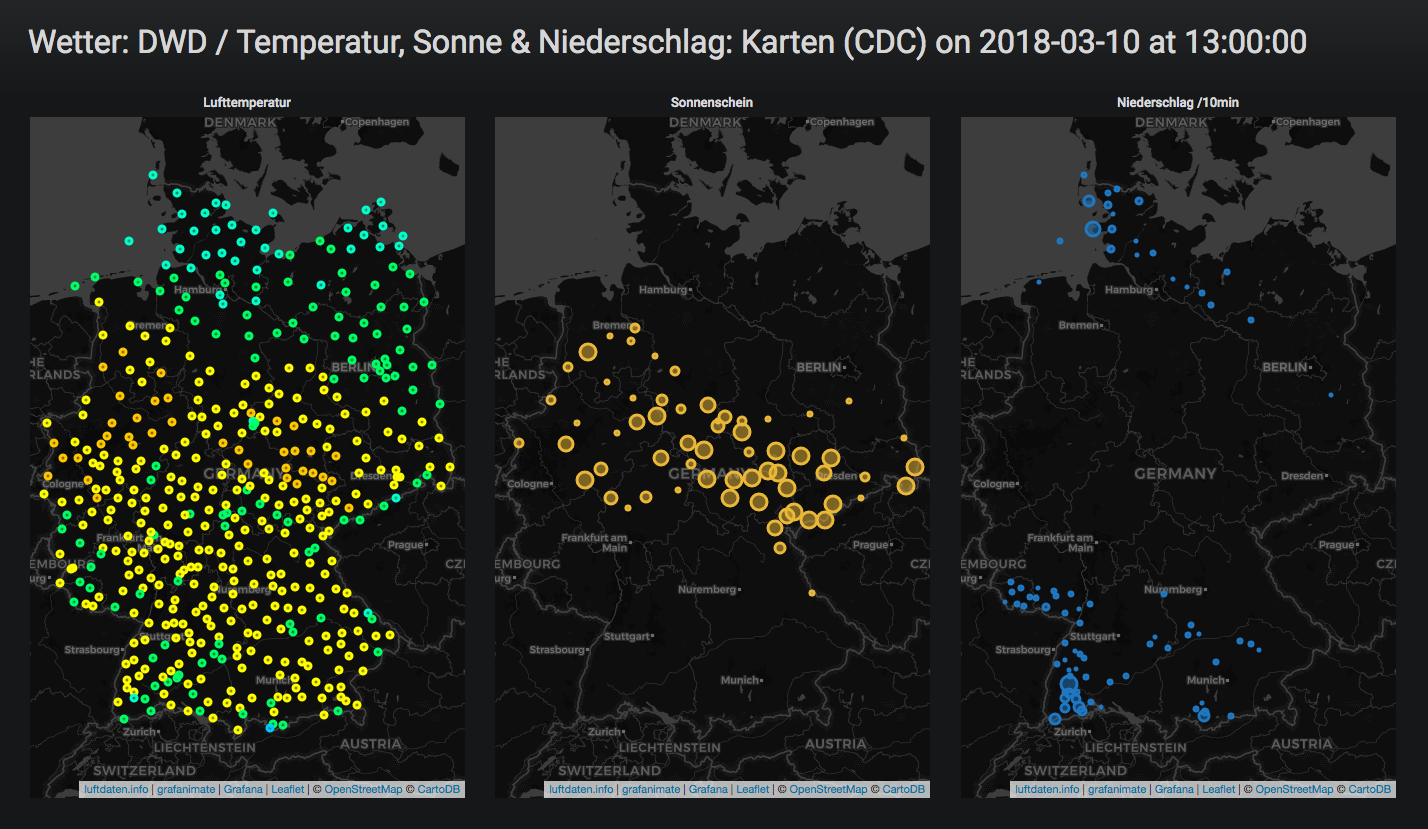
DWD CDC

Short weather film about temperature, sun and precipitation based on DWD/CDC data in March 2018.
Data source: DWD Open Data (DWD)
Production: DWD Climate Data Center (CDC), 10m-Werte: Aktuelle Lufttemperaturen, Sonnenscheindauer & Niederschlag
Development: <work in progress>
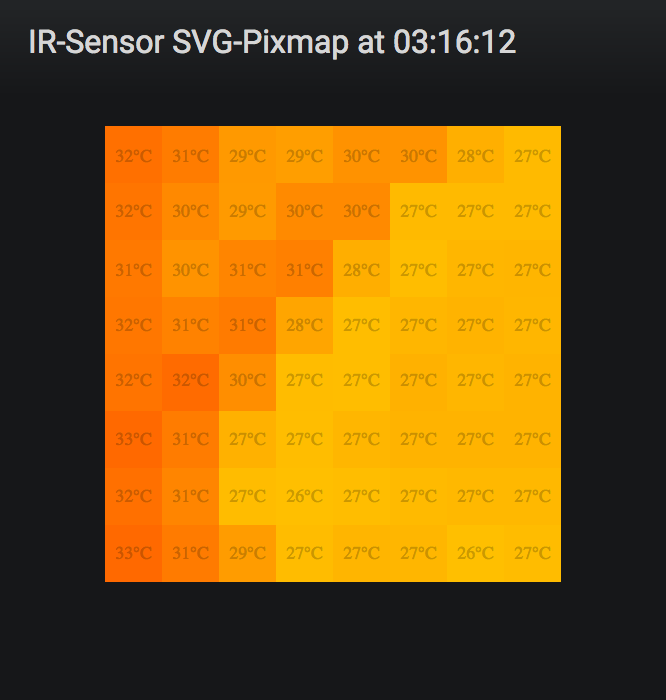
IR-Sensor SVG-Pixmap

IR-Sensor SVG-Pixmap displaying temperature changes inside a beehive.
Data source: Clemens Gruber (CG)
Development: How to Visualize 2-Dimensional Temperature Data in Grafana
Usage
$ grafanimate --help

Usage:
  grafanimate [options] [--target=<target>]...
  grafanimate --version
  grafanimate (-h | --help)

Options:
  --grafana-url=<url>           Base URL to Grafana, [default: http://localhost:3000].
  --scenario=<scenario>         Which scenario to run. Scenarios are defined as methods.
  --dashboard-uid=<uid>         Grafana dashboard uid.

Optional:
  --panel-id=<id>               Render single panel only by navigating to "panelId=<id>&fullscreen".
  --dashboard-view=<mode>       Use Grafana's "d-solo" view for rendering single panels without header.

  --header-layout=<layout>      The header rendering subsystem offers different modes
                                for amending the vanilla Grafana user interface.
                                Multiple modes can be combined.
                                [default: large-font]

                                - no-chrome:            Set kiosk mode, remove sidemenu and more chrome
                                - large-font:           Use larger font sizes for title and datetime
                                - collapse-datetime:    Collapse datetime into title
                                - studio:               Apply studio modifications. This options aggregates
                                                        "no-chrome", "large-font" and "collapse-datetime".
                                - no-folder:            Don't include foldername in title

                                - no-title:             Turn off title widget
                                - no-datetime:          Turn off datetime widget

  --datetime-format=<format>    Datetime format to use with header layouts like "studio".
                                Examples: YYYY-MM-DD HH:mm:ss, YYYY, HH:mm.

                                There are also some format presets available here:
                                - human-date:           on 2018-08-14
                                - human-time:           at 03:16:05
                                - human-datetime:       on 2018-08-14 at 03:16:05

                                When left empty, the default is determined by the configured interval.

  --debug                       Enable debug logging
  -h --help                     Show this screen


Examples for scenario mode. Script your animation in file "scenarios.py".

  # Generate sequence of .png files in ./var/spool/ldi_all/1aOmc1sik
  grafanimate --grafana-url=http://localhost:3000/ --scenario=ldi_all --dashboard-uid=1aOmc1sik

  # Use more parameters to control the rendering process.
  grafanimate --grafana-url=http://localhost:3000/ --scenario=ir_sensor_svg_pixmap --dashboard-uid=_TbvFUyik --header-layout=studio --datetime-format=human-time --panel-id=6
Setup
Prerequisites
This program uses the fine ffmpeg for doing the heavy lifting.
grafanimate
virtualenv --python=python2 .venv2
source .venv2/bin/activate
pip install grafanimate
Background and details
Introduction
Animating things in Grafana across the time-axis in the spirit of the GeoLoop Panel Plugin hasn’t been unlocked for Grafana in a more general way yet. Challenge accepted!
Time warp
At this programs’ core is the code to set time range in Grafana:
timeSrv = angular.element('grafana-app').injector().get('timeSrv');
timeSrv.setTime({from: "2015-10-01", to: "2018-12-31"});
Rendering engine
Turtles all the way up, the main rendering work horse is a Firefox Browser automated through Marionette Python Client fame:
The Marionette Python client library allows you to remotely control a Gecko-based browser or device which is running a Marionette server.
Outlook
Neither Playlists nor Scripted Dashboards offer these things to the user, but this program can be combined with both in order to implement more complex animations on top of Grafana.
Project information
grafanimate is released under the GNU AGPL v3 license.
The code lives on GitHub and the Python package is published to PyPI.
The software has been tested on Python 2.7.
Contributing
We are always happy to receive code contributions, ideas, suggestions and problem reports from the community. Spend some time taking a look around, locate a bug, design issue or spelling mistake and then send us a pull request or create an issue.
License
This program is free software; you can redistribute it and/or modify it under the terms of the GNU Affero General Public License as published by the Free Software Foundation; either version 3 of the License, or (at your option) any later version.
This program is distributed in the hope that it will be useful, but WITHOUT ANY WARRANTY; without even the implied warranty of MERCHANTABILITY or FITNESS FOR A PARTICULAR PURPOSE. See the GNU General Public License for more details.
You should have received a copy of the GNU Affero General Public License along with this program; if not, see: <http://www.gnu.org/licenses/agpl-3.0.txt>, or write to the Free Software Foundation, Inc., 51 Franklin Street, Fifth Floor, Boston, MA 02110-1301 USA
Project details
Release history Release notifications | RSS feed
Download files
Download the file for your platform. If you're not sure which to choose, learn more about installing packages.


