Label lines in matplotlib.

Project description
matplotlib-label-lines


Easily label line(s) using matplotlib.
The code is heavily based on http://stackoverflow.com/questions/16992038/inline-labels-in-matplotlib (original code from NauticalMile).
Install
Just do:
pip install matplotlib-label-lines
You can try it online on binder 
import numpy as np
from matplotlib import pyplot as plt
from scipy.stats import chi2, loglaplace
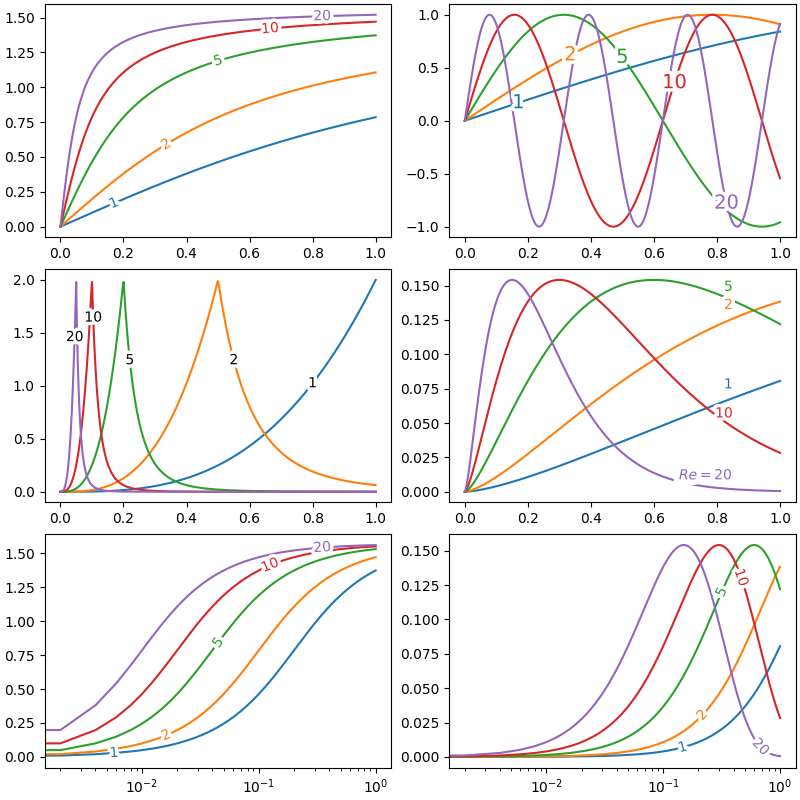
from labellines import labelLine, labelLines
X = np.linspace(0, 1, 500)
A = [1, 2, 5, 10, 20]
funcs = [np.arctan, np.sin, loglaplace(4).pdf, chi2(5).pdf]
plt.subplot(321)
for a in A:
plt.plot(X, np.arctan(a * X), label=str(a))
labelLines(plt.gca().get_lines(), zorder=2.5)
plt.subplot(322)
for a in A:
plt.plot(X, np.sin(a * X), label=str(a))
labelLines(plt.gca().get_lines(), align=False, fontsize=14)
plt.subplot(323)
for a in A:
plt.plot(X, loglaplace(4).pdf(a * X), label=str(a))
xvals = [0.8, 0.55, 0.22, 0.104, 0.045]
labelLines(plt.gca().get_lines(), align=False, xvals=xvals, color="k")
plt.subplot(324)
for a in A:
plt.plot(X, chi2(5).pdf(a * X), label=str(a))
lines = plt.gca().get_lines()
l1 = lines[-1]
labelLine(
l1,
0.6,
label=r"$Re=${}".format(l1.get_label()),
ha="left",
va="bottom",
align=False,
backgroundcolor='none'
)
labelLines(lines[:-1], yoffsets=0.01, align=False, backgroundcolor='none')
# labelLines also supports log-scaled x-axes
plt.subplot(325)
for a in A:
plt.semilogx(X, np.arctan(5 * a * X), label=str(a))
labelLines(plt.gca().get_lines(), zorder=2.5)
plt.subplot(326)
for a in A:
plt.semilogx(X, chi2(5).pdf(a * X), label=str(a))
labelLines(plt.gca().get_lines(), xvals=(0.1, 1), zorder=2.5)
plt.show()
Release history Release notifications | RSS feed


Download files
Download the file for your platform. If you're not sure which to choose, learn more about installing packages.
Source Distribution
Built Distribution
Close
Hashes for matplotlib_label_lines-0.4.2.tar.gz
| Algorithm | Hash digest | |
|---|---|---|
| SHA256 | 1d2a498217113ef5c9d9933b32919d785a715034a181b002889fd48fc04622f3 |
|
| MD5 | adae425222bc4f6a93a61294f8b8c8b1 |
|
| BLAKE2b-256 | 54704ee595481aa25ccf5bb3cb1617b24a8867ba67d629696fcaad740de64b4b |
Close
Hashes for matplotlib_label_lines-0.4.2-py3-none-any.whl
| Algorithm | Hash digest | |
|---|---|---|
| SHA256 | 44f067290459fb779c472cba9dc00de0b4fb46abf4c2f85374f4723c9559a1a5 |
|
| MD5 | 4795ad527c3214bbd6cba915f759e167 |
|
| BLAKE2b-256 | 999edfe38eb560105a34e8f11f05b1135b8e44cc4833c83b668f353192eb4650 |


