Label lines in matplotlib.

Project description
matplotlib-label-lines


Easily label line(s) using matplotlib.
The code is heavily based on http://stackoverflow.com/questions/16992038/inline-labels-in-matplotlib (original code from NauticalMile).
Install
Just do:
pip install matplotlib-label-lines
You can try it online on binder 
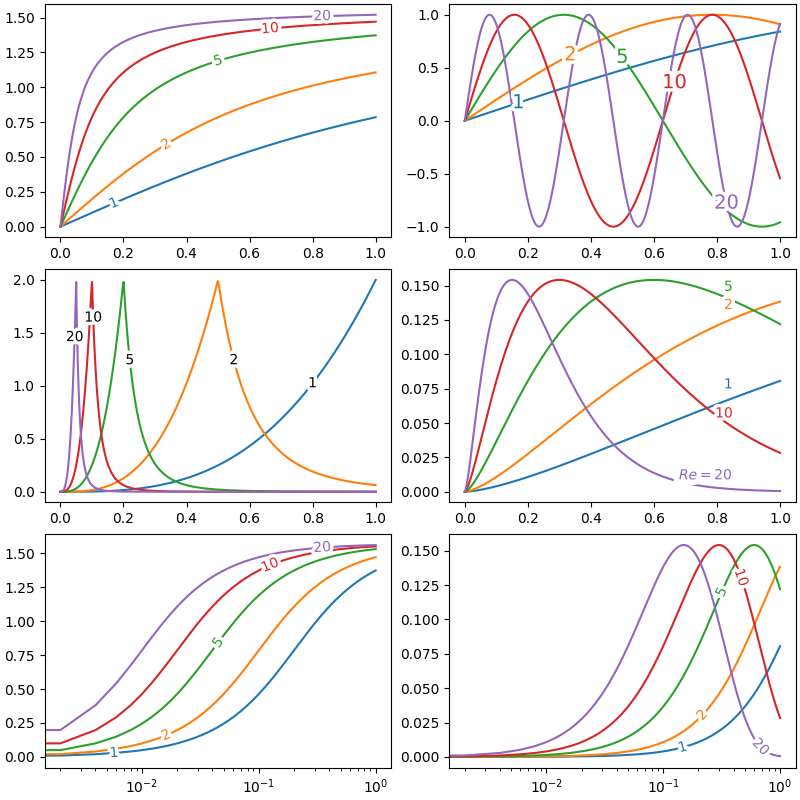
import numpy as np
from matplotlib import pyplot as plt
from scipy.stats import chi2, loglaplace

from labellines import labelLine, labelLines

X = np.linspace(0, 1, 500)
A = [1, 2, 5, 10, 20]
funcs = [np.arctan, np.sin, loglaplace(4).pdf, chi2(5).pdf]

plt.subplot(321)
for a in A:
    plt.plot(X, np.arctan(a * X), label=str(a))

labelLines(plt.gca().get_lines(), zorder=2.5)

plt.subplot(322)
for a in A:
    plt.plot(X, np.sin(a * X), label=str(a))

labelLines(plt.gca().get_lines(), align=False, fontsize=14)

plt.subplot(323)
for a in A:
    plt.plot(X, loglaplace(4).pdf(a * X), label=str(a))

xvals = [0.8, 0.55, 0.22, 0.104, 0.045]
labelLines(plt.gca().get_lines(), align=False, xvals=xvals, color="k")

plt.subplot(324)
for a in A:
    plt.plot(X, chi2(5).pdf(a * X), label=str(a))

lines = plt.gca().get_lines()
l1 = lines[-1]
labelLine(
    l1,
    0.6,
    label=r"$Re=${}".format(l1.get_label()),
    ha="left",
    va="bottom",
    align=False,
    backgroundcolor='none'
)
labelLines(lines[:-1], yoffsets=0.01, align=False, backgroundcolor='none')

# labelLines also supports log-scaled x-axes
plt.subplot(325)
for a in A:
    plt.semilogx(X, np.arctan(5 * a * X), label=str(a))

labelLines(plt.gca().get_lines(), zorder=2.5)

plt.subplot(326)
for a in A:
    plt.semilogx(X, chi2(5).pdf(a * X), label=str(a))

labelLines(plt.gca().get_lines(), xvals=(0.1, 1), zorder=2.5)

plt.show()
Release history Release notifications | RSS feed


Download files
Download the file for your platform. If you're not sure which to choose, learn more about installing packages.
Source Distribution
Built Distribution
Close
Hashes for matplotlib_label_lines-0.4.3.tar.gz
| Algorithm | Hash digest | |
|---|---|---|
| SHA256 | e143615f22207efae8b650fe9cb13d409ec4ac8002d9850e824572943a57627e |
|
| MD5 | cac11bb3c0452cdd1560be1b8e0e250e |
|
| BLAKE2b-256 | eedf5b839ebe57408cc36d5f7622b80aad7f2f6d4f37322f62f070f078004e83 |
Close
Hashes for matplotlib_label_lines-0.4.3-py3-none-any.whl
| Algorithm | Hash digest | |
|---|---|---|
| SHA256 | 936d5bd11eda992d2b0371b63a0b69a593afbe67f6f05fd766711fe6c83eef51 |
|
| MD5 | 75dfe2a8cd29c29107a4d50453e4a6e2 |
|
| BLAKE2b-256 | cafc5958b033271275f40b4a025eab4aacf22a9bb71db11a6371c7bc92582f49 |


