Label lines in matplotlib.

Project description
matplotlib-label-lines


Easily label line(s) using matplotlib.
The code is heavily based on http://stackoverflow.com/questions/16992038/inline-labels-in-matplotlib (original code from NauticalMile).
Install
Just do:
pip install matplotlib-label-lines
You can try it online on binder 
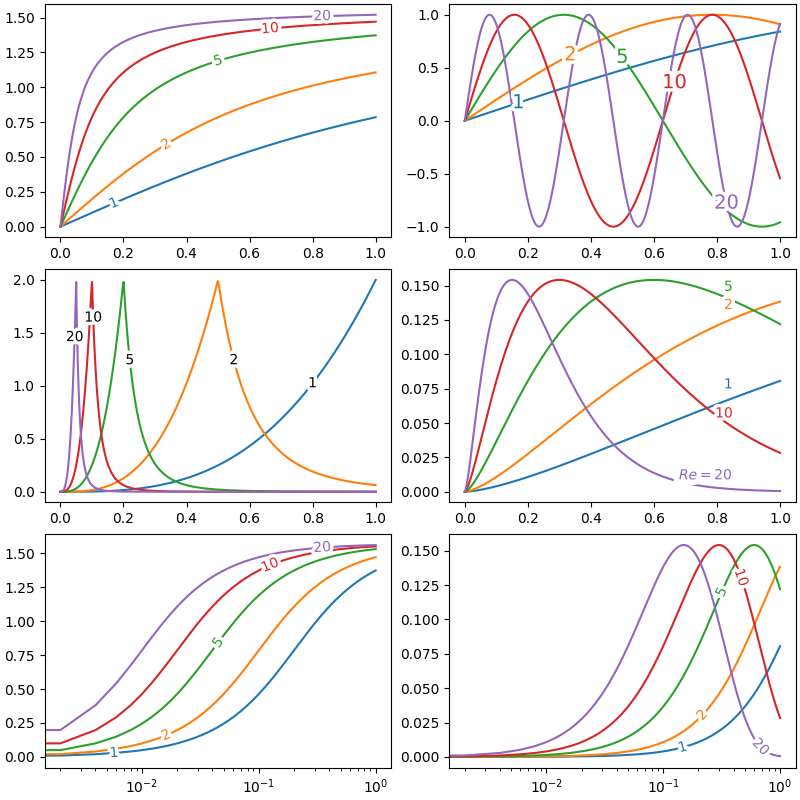
import numpy as np
from matplotlib import pyplot as plt
from scipy.stats import chi2, loglaplace

from labellines import labelLine, labelLines

X = np.linspace(0, 1, 500)
A = [1, 2, 5, 10, 20]
funcs = [np.arctan, np.sin, loglaplace(4).pdf, chi2(5).pdf]

fig, axes = plt.subplots(ncols=2, nrows=3, constrained_layout=True, figsize=(8, 8))

axes = axes.flatten()

ax = axes[0]
for a in A:
    ax.plot(X, np.arctan(a * X), label=str(a))

labelLines(ax.get_lines(), zorder=2.5)

ax = axes[1]
for a in A:
    ax.plot(X, np.sin(a * X), label=str(a))

labelLines(ax.get_lines(), align=False, fontsize=14)

ax = axes[2]
for a in A:
    ax.plot(X, loglaplace(4).pdf(a * X), label=str(a))

xvals = [0.8, 0.55, 0.22, 0.104, 0.045]
labelLines(ax.get_lines(), align=False, xvals=xvals, color="k")

ax = axes[3]
for a in A:
    ax.plot(X, chi2(5).pdf(a * X), label=str(a))

lines = ax.get_lines()
l1 = lines[-1]
labelLine(
    l1,
    0.6,
    label=r"$Re=${}".format(l1.get_label()),
    ha="left",
    va="bottom",
    align=False,
    backgroundcolor="none",
)
labelLines(lines[:-1], yoffsets=0.01, align=False, backgroundcolor="none")

# labelLines also supports log-scaled x-axes
ax = axes[4]
for a in A:
    ax.semilogx(X, np.arctan(5 * a * X), label=str(a))

labelLines(ax.get_lines(), zorder=2.5)

ax = axes[5]
for a in A:
    ax.semilogx(X, chi2(5).pdf(a * X), label=str(a))

labelLines(ax.get_lines(), xvals=(0.1, 1), zorder=2.5)

fig.show()
Release history Release notifications | RSS feed


Download files
Download the file for your platform. If you're not sure which to choose, learn more about installing packages.
Source Distribution
Built Distribution
Close
Hashes for matplotlib_label_lines-0.5.1.tar.gz
| Algorithm | Hash digest | |
|---|---|---|
| SHA256 | c75327811efedc4818994c71dfad5283ed710fa1d35555edd924e1a9aac32b6b |
|
| MD5 | 5bb378d51b2e7be2f209122b6facfd3e |
|
| BLAKE2b-256 | b94fb97524a9d62e25db791c43ad637bcb928a4a08f267191064caa2b959e261 |
Close
Hashes for matplotlib_label_lines-0.5.1-py3-none-any.whl
| Algorithm | Hash digest | |
|---|---|---|
| SHA256 | ca73fbaaccb7982aa5a510831e8fdf1c648c2db2c7326259e7ca9bdc61d6ddf2 |
|
| MD5 | 0bb17d2b7fd36bba9527bfc03391ae67 |
|
| BLAKE2b-256 | 56574cd6b9fa78b44f19644bf66e512570446bc735fe010274da8554f2530a05 |


