OpenWISP 2 Monitoring
Project description


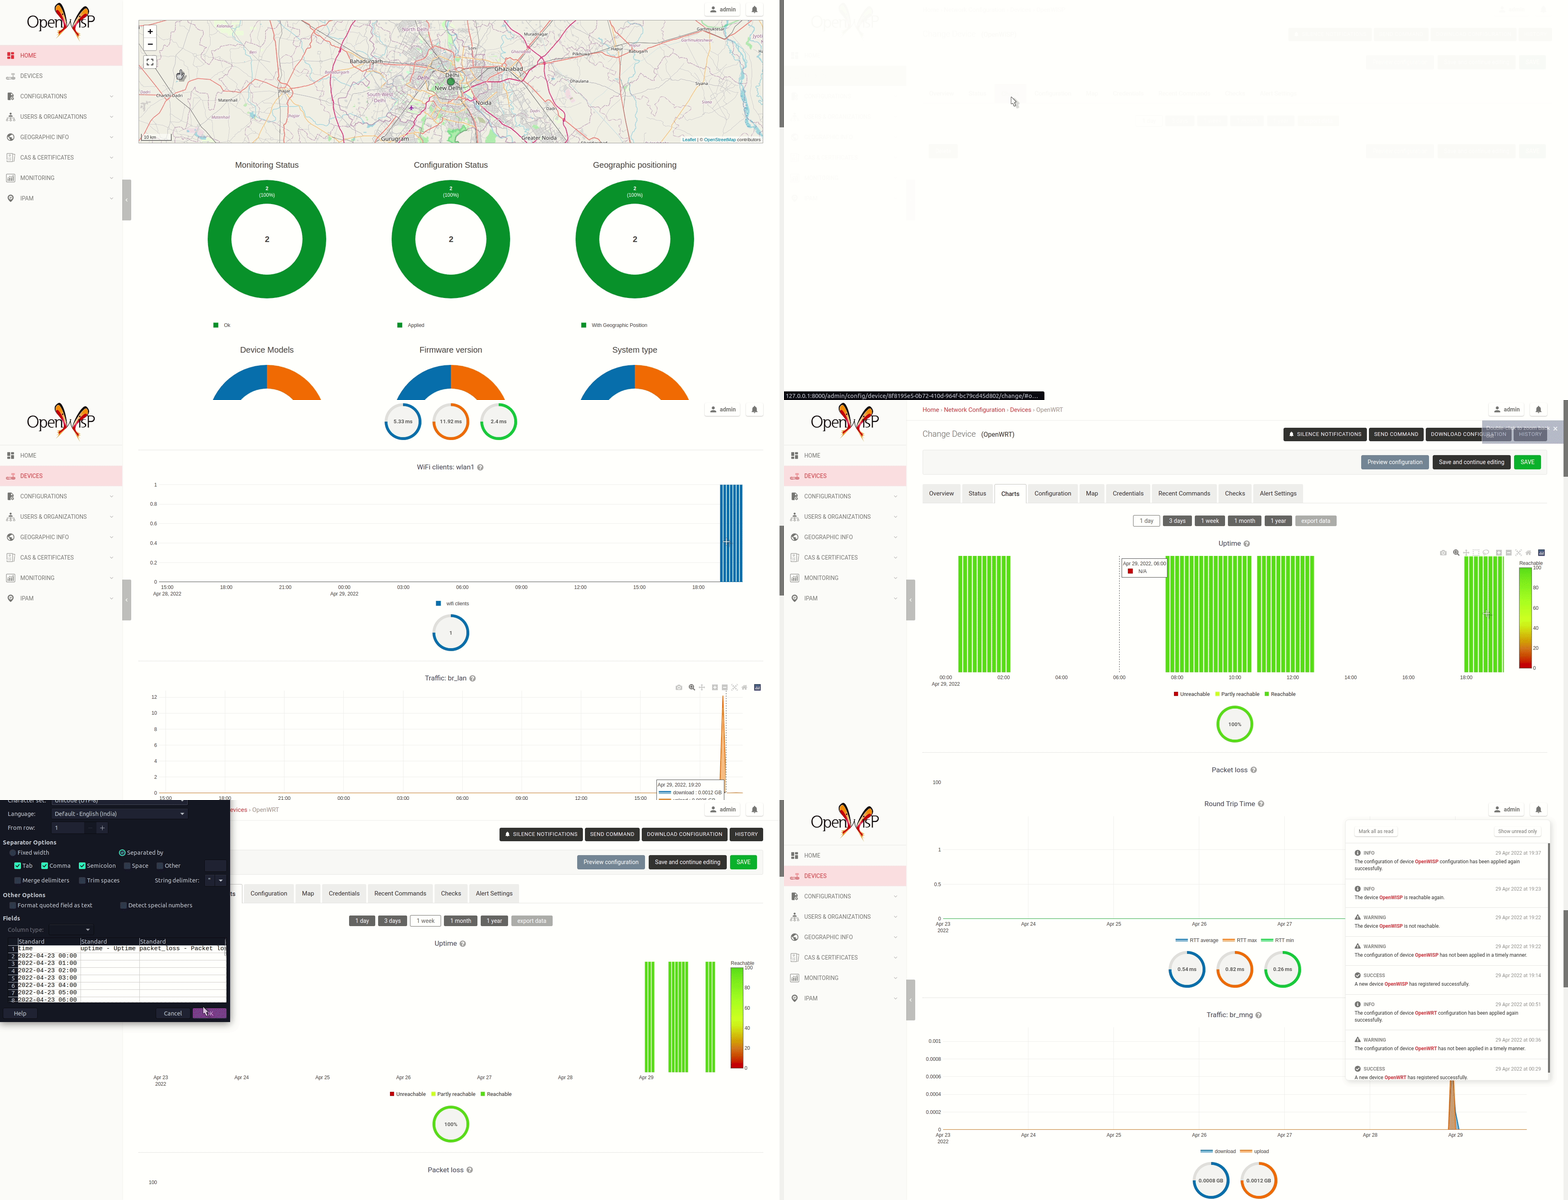
OpenWISP Monitoring is a network monitoring system written in Python and Django, designed to be extensible, programmable, scalable and easy to use by end users: once the system is configured, monitoring checks, alerts and metric collection happens automatically.
See the available features.
OpenWISP is not only an application designed for end users, but can also be used as a framework on which custom network automation solutions can be built on top of its building blocks.
Other popular building blocks that are part of the OpenWISP ecosystem are:
openwisp-controller: network and WiFi controller: provisioning, configuration management, x509 PKI management and more; works on OpenWRT, but designed to work also on other systems.
openwisp-network-topology: provides way to collect and visualize network topology data from dynamic mesh routing daemons or other network software (eg: OpenVPN); it can be used in conjunction with openwisp-monitoring to get a better idea of the state of the network
openwisp-firmware-upgrader: automated firmware upgrades (single device or mass network upgrades)
openwisp-radius: based on FreeRADIUS, allows to implement network access authentication systems like 802.1x WPA2 Enterprise, captive portal authentication, Hotspot 2.0 (802.11u)
openwisp-ipam: it allows to manage the IP address space of networks
For a more complete overview of the OpenWISP modules and architecture, see the OpenWISP Architecture Overview.
Available Features
Collection of monitoring information in a timeseries database (currently only influxdb is supported)
Allows to browse alerts easily from the user interface with one click
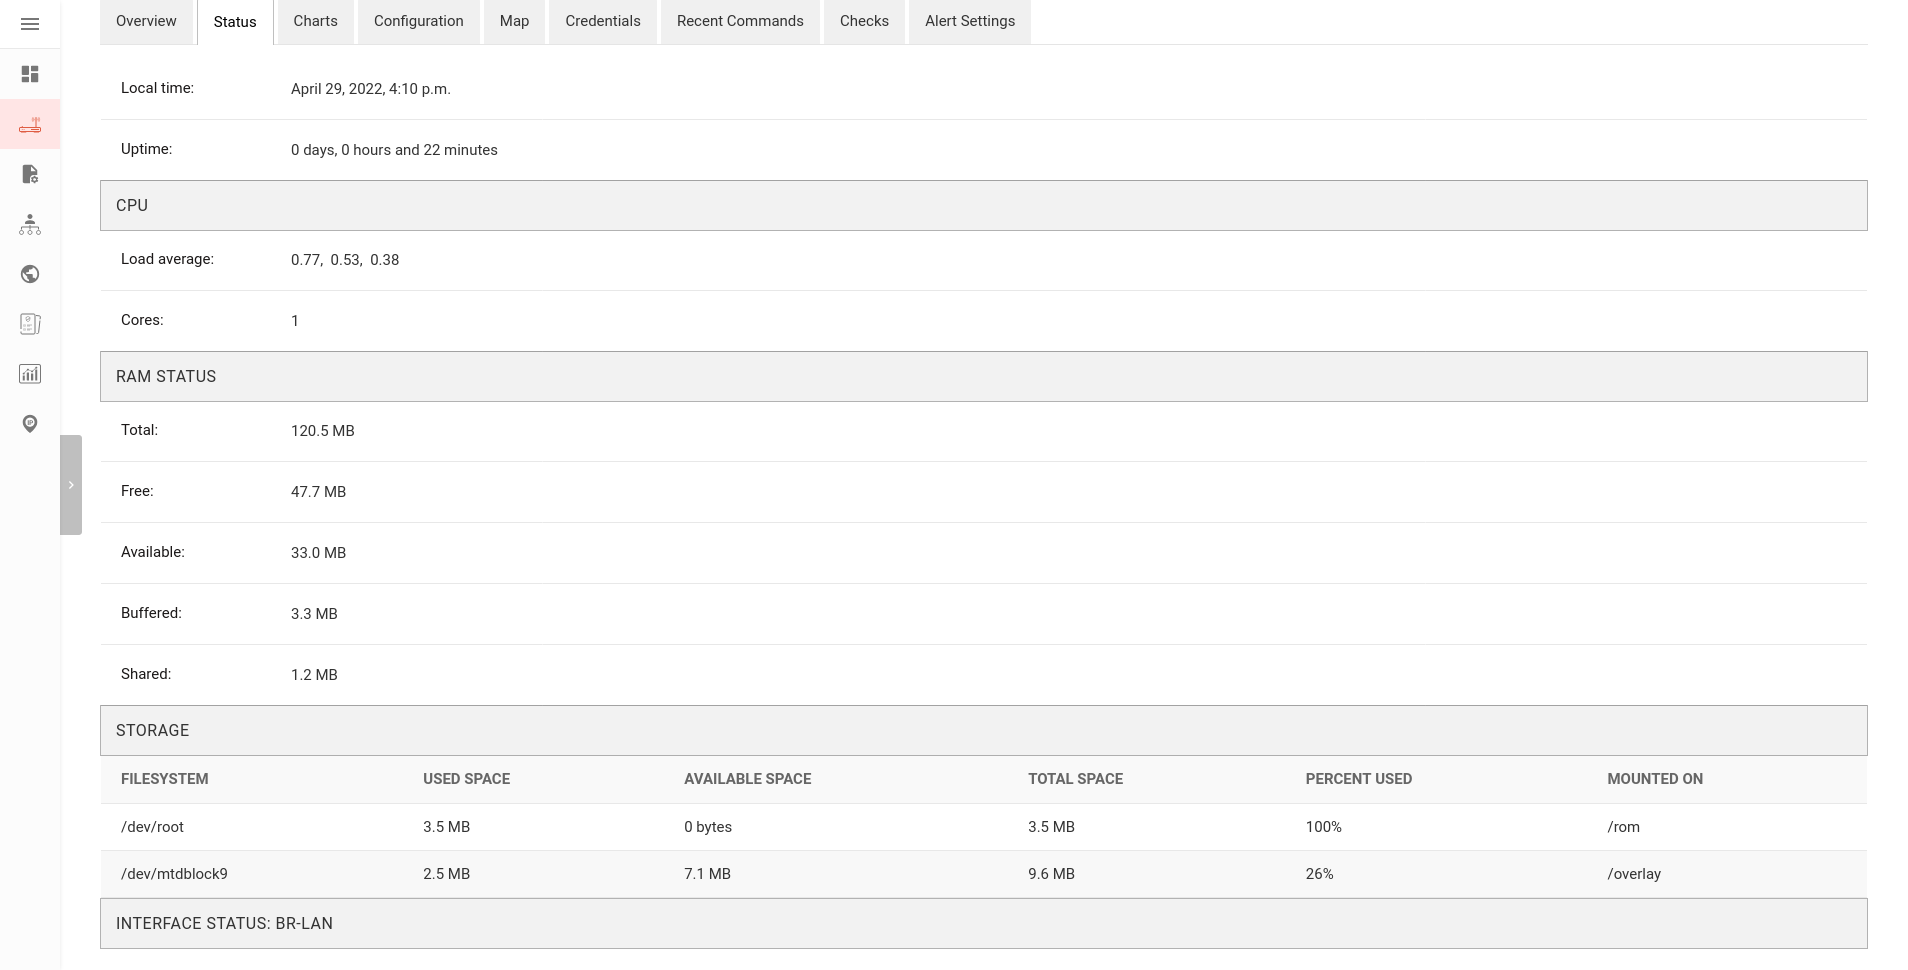
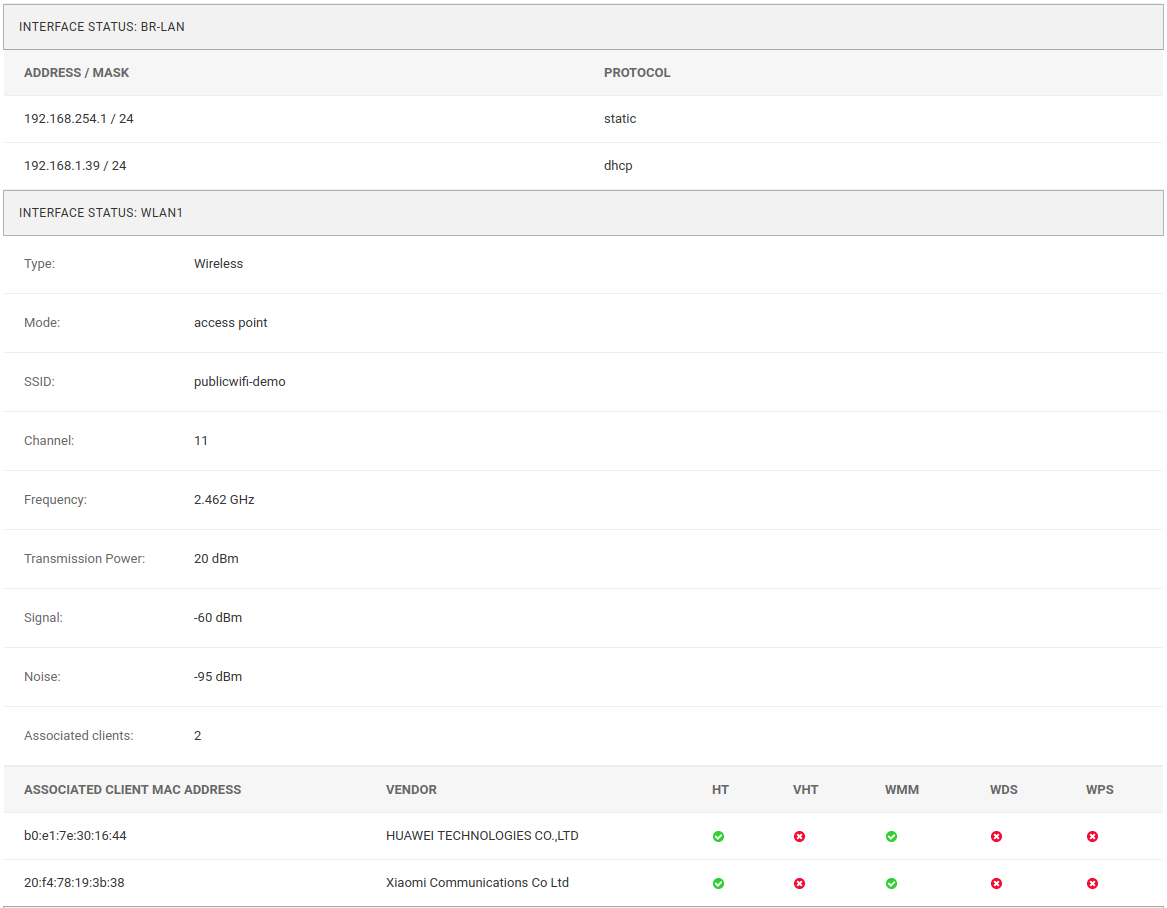
Collects and displays device status information like uptime, RAM status, CPU load averages, Interface properties and addresses, WiFi interface status and associated clients, Neighbors information, DHCP Leases, Disk/Flash status
Monitoring charts for uptime, packet loss, round trip time (latency), associated wifi clients, interface traffic, RAM usage, CPU load, flash/disk usage, mobile signal (LTE/UMTS/GSM signal strength, signal quality, access technology in use)
Charts can be viewed at resolutions of 1 day, 3 days, a week, a month and a year
Configurable alerts
CSV Export of monitoring data
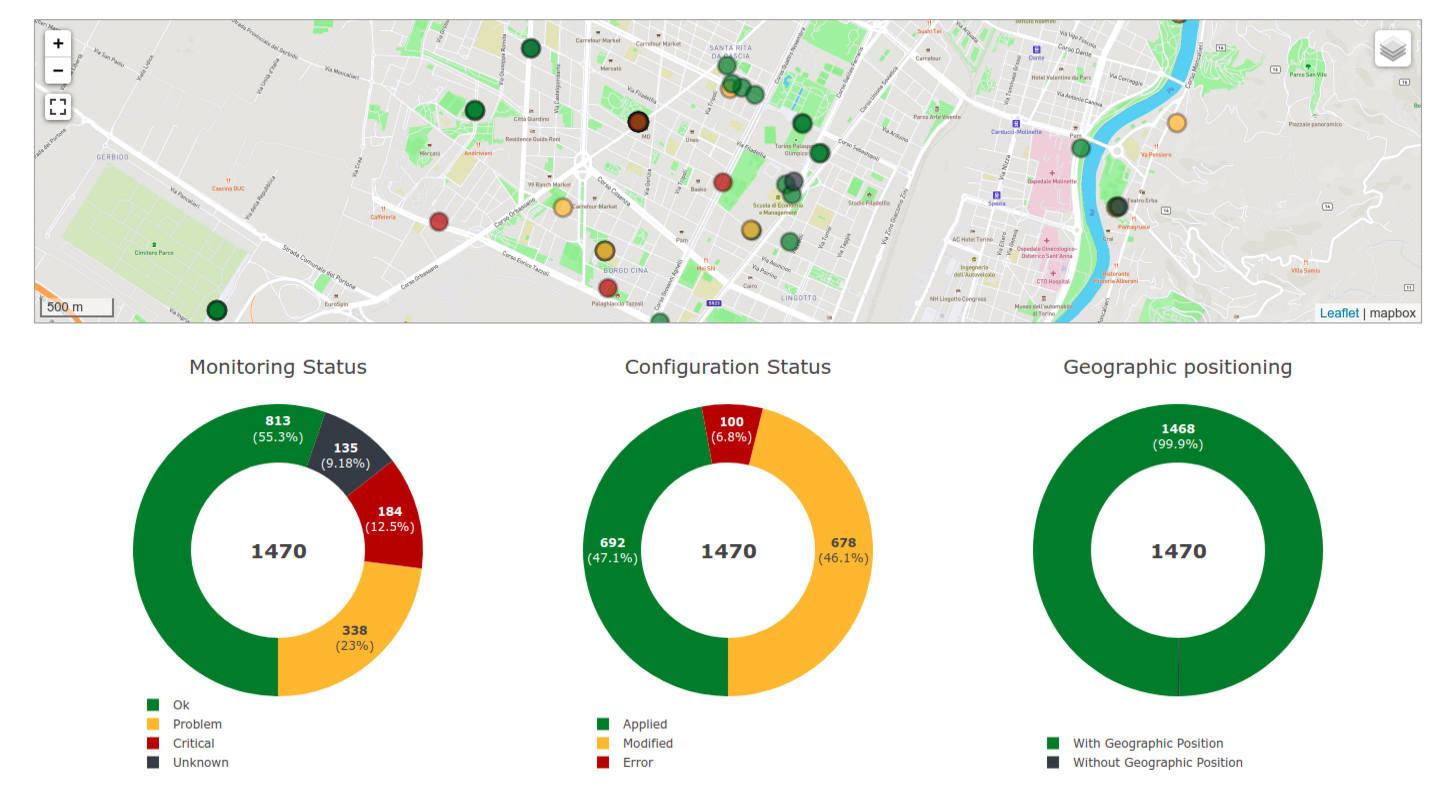
An overview of the status of the network is shown in the admin dashboard, a chart shows the percentages of devices which are online, offline or having issues; a geographic map is also available for those who use the geographic features of OpenWISP
Extensible active check system: it’s possible to write additional checks that are run periodically using python classes
Extensible metrics and charts: it’s possible to define new metrics and new charts
API to retrieve the chart metrics and status information of each device based on NetJSON DeviceMonitoring
Installation instructions
Deploy it in production
See:
Install system dependencies
openwisp-monitoring uses InfluxDB to store metrics. Follow the installation instructions from InfluxDB’s official documentation.
Note: Only InfluxDB 1.8.x is supported in openwisp-monitoring.
Install system packages:
sudo apt install -y openssl libssl-dev \
                    gdal-bin libproj-dev libgeos-dev \
                    fping
Install stable version from PyPI
Install from PyPI:
pip install openwisp-monitoringInstall development version
Install tarball:
pip install https://github.com/openwisp/openwisp-monitoring/tarball/masterAlternatively, you can install via pip using git:
pip install -e git+git://github.com/openwisp/openwisp-monitoring#egg=openwisp_monitoringIf you want to contribute, follow the instructions in “Installing for development” section.
Installing for development
Install the system dependencies as mentioned in the “Install system dependencies” section. Install these additional packages that are required for development:
sudo apt install -y sqlite3 libsqlite3-dev \
                    libspatialite-dev libsqlite3-mod-spatialite \
                    chromium
Fork and clone the forked repository:
git clone git://github.com/<your_fork>/openwisp-monitoringNavigate into the cloned repository:
cd openwisp-monitoring/Start Redis and InfluxDB using Docker:
docker-compose up -d redis influxdbSetup and activate a virtual-environment. (we’ll be using virtualenv)
python -m virtualenv env
source env/bin/activate
Make sure that you are using pip version 20.2.4 before moving to the next step:
pip install -U pip wheel setuptoolsInstall development dependencies:
pip install -e .
pip install -r requirements-test.txt
npm install -g jshint stylelint
Install WebDriver for Chromium for your browser version from https://chromedriver.chromium.org/home and extract chromedriver to one of directories from your $PATH (example: ~/.local/bin/).
Create database:
cd tests/
./manage.py migrate
./manage.py createsuperuser
Run celery and celery-beat with the following commands (separate terminal windows are needed):
cd tests/
celery -A openwisp2 worker -l info
celery -A openwisp2 beat -l info
Launch development server:
./manage.py runserver 0.0.0.0:8000You can access the admin interface at http://127.0.0.1:8000/admin/.
Run tests with:
./runtests.py --parallelRun quality assurance tests with:
./run-qa-checksInstall and run on docker
Note: This Docker image is for development purposes only. For the official OpenWISP Docker images, see: docker-openwisp.
Build from the Dockerfile:
docker-compose buildRun the docker container:
docker-compose upSetup (integrate in an existing Django project)
Follow the setup instructions of openwisp-controller, then add the settings described below.
INSTALLED_APPS = [
    # django apps
    # all-auth
    'django.contrib.sites',
    'allauth',
    'allauth.account',
    'allauth.socialaccount',
    'django_extensions',
    'django_filters',
    # openwisp2 modules
    'openwisp_users',
    'openwisp_controller.pki',
    'openwisp_controller.config',
    'openwisp_controller.connection',
    'openwisp_controller.geo',
    # monitoring
    'openwisp_monitoring.monitoring',
    'openwisp_monitoring.device',
    'openwisp_monitoring.check',
    'nested_admin',
    # notifications
    'openwisp_notifications',
    # openwisp2 admin theme (must be loaded here)
    'openwisp_utils.admin_theme',
    # admin
    'django.contrib.admin',
    'django.forms',
    # other dependencies ...
]

# Make sure you change them in production
# You can select one of the backends located in openwisp_monitoring.db.backends
TIMESERIES_DATABASE = {
    'BACKEND': 'openwisp_monitoring.db.backends.influxdb',
    'USER': 'openwisp',
    'PASSWORD': 'openwisp',
    'NAME': 'openwisp2',
    'HOST': 'localhost',
    'PORT': '8086',
}urls.py:
from django.conf import settings
from django.conf.urls import include, url
from django.contrib.staticfiles.urls import staticfiles_urlpatterns

from openwisp_utils.admin_theme.admin import admin, openwisp_admin

openwisp_admin()

urlpatterns = [
    url(r'^admin/', include(admin.site.urls)),
    url(r'', include('openwisp_controller.urls')),
    url(r'', include('openwisp_monitoring.urls')),
]

urlpatterns += staticfiles_urlpatterns()
Configure caching (you may use a different cache storage if you want):
CACHES = {
    'default': {
        'BACKEND': 'django_redis.cache.RedisCache',
        'LOCATION': 'redis://localhost/0',
        'OPTIONS': {
            'CLIENT_CLASS': 'django_redis.client.DefaultClient',
        }
    }
}

SESSION_ENGINE = 'django.contrib.sessions.backends.cache'
SESSION_CACHE_ALIAS = 'default'
Configure celery (you may use a different broker if you want):
# here we show how to configure celery with redis but you can
# use other brokers if you want, consult the celery docs
CELERY_BROKER_URL = 'redis://localhost/1'
CELERY_BEAT_SCHEDULE = {
    'run_checks': {
        'task': 'openwisp_monitoring.check.tasks.run_checks',
        'schedule': timedelta(minutes=5),
    },
}

INSTALLED_APPS.append('djcelery_email')
EMAIL_BACKEND = 'djcelery_email.backends.CeleryEmailBackend'
If you decide to use Redis (as shown in these examples), install the following python packages.
pip install redis django-redisQuickstart Guide
Install OpenWISP Monitoring
Install OpenWISP Monitoring using one of the methods mentioned in the “Installation instructions”.
Install openwisp-config on the device
Install the openwisp-config agent for OpenWrt on your device.
Install monitoring packages on the device
Install the openwrt-openwisp-monitoring packages on your device.
These packages collect and send the monitoring data from the device to OpenWISP Monitoring and are required to collect metrics like interface traffic, WiFi clients, CPU load, memory usage, etc.
Note: if you are an existing user of openwisp-monitoring and are using the legacy monitoring template for collecting metrics, we highly recommend Migrating from monitoring scripts to monitoring packages.
Make sure OpenWISP can reach your devices
In order to perform active checks and other actions like triggering the push of configuration changes, executing shell commands or performing firmware upgrades, the OpenWISP server needs to be able to reach the network devices.
There are mainly two deployment scenarios for OpenWISP:
the OpenWISP server is deployed on the public internet and the devices are geographically distributed across different locations: in this case a management tunnel is needed
the OpenWISP server is deployed on a computer/server which is located in the same Layer 2 network (that is, in the same LAN) where the devices are located. in this case a management tunnel is NOT needed
1. Public internet deployment
This is the most common scenario:
the OpenWISP server is deployed to the public internet, hence the server has a public IPv4 (and IPv6) address and usually a valid SSL certificate provided by Mozilla Letsencrypt or another SSL provider
the network devices are geographically distributed across different locations (different cities, different regions, different countries)
In this scenario, the OpenWISP application will not be able to reach the devices unless a management tunnel is used, for that reason having a management VPN like OpenVPN, Wireguard or any other tunneling solution is paramount, not only to allow OpenWISP to work properly, but also to be able to perform debugging and troubleshooting when needed.
In this scenario, the following requirements are needed:
a VPN server must be installed in a way that the OpenWISP server can reach the VPN peers, for more information on how to do this via OpenWISP please refer to the following sections:
If you prefer to use other tunneling solutions (L2TP, Softether, etc.) and know how to configure those solutions on your own, that’s totally fine as well.
If the OpenWISP server is connected to a network infrastructure which allows it to reach the devices via pre-existing tunneling or Intranet solutions (eg: MPLS, SD-WAN), then setting up a VPN server is not needed, as long as there’s a dedicated interface on OpenWrt which gets an IP address assigned to it and which is reachable from the OpenWISP server.
The devices must be configured to join the management tunnel automatically, either via a pre-existing configuration in the firmware or via an OpenWISP Template.
The openwisp-config agent on the devices must be configured to specify the management_interface option, the agent will communicate the IP of the management interface to the OpenWISP Server and OpenWISP will use the management IP for reaching the device.
For example, if the management interface is named tun0, the openwisp-config configuration should look like the following example:
# In /etc/config/openwisp on the device

config controller 'http'
    # ... other configuration directives ...
    option management_interface 'tun0'
2. LAN deployment
When the OpenWISP server and the network devices are deployed in the same L2 network (eg: an office LAN) and the OpenWISP server is reachable on the LAN address, OpenWISP can then use the Last IP field of the devices to reach them.
In this scenario it’s necessary to set the “OPENWISP_MONITORING_MANAGEMENT_IP_ONLY” setting to False.
Creating checks for a device
By default, the active checks are created automatically for all devices, unless the automatic creation of some specific checks has been disabled, for more information on how to do this, refer to the active checks section.
These checks are created and executed in the background by celery workers.
Passive vs Active Metric Collection
The the different device metric collected by OpenWISP Monitoring can be divided in two categories:
metrics collected actively by OpenWISP: these metrics are collected by the celery workers running on the OpenWISP server, which continuously sends network requests to the devices and store the results;
metrics collected passively by OpenWISP: these metrics are sent by the openwrt-openwisp-monitoring agent installed on the network devices and are collected by OpenWISP via its REST API.
The “Available Checks” section of this document lists the currently implemented active checks.
Device Health Status
The possible values for the health status field (DeviceMonitoring.status) are explained below.
UNKNOWN
Whenever a new device is created it will have UNKNOWN as it’s default Heath Status.
It implies that the system doesn’t know whether the device is reachable yet.
OK
Everything is working normally.
PROBLEM
One of the metrics has a value which is not in the expected range (the threshold value set in the alert settings has been crossed).
Example: CPU usage should be less than 90% but current value is at 95%.
CRITICAL
One of the metrics defined in OPENWISP_MONITORING_CRITICAL_DEVICE_METRICS has a value which is not in the expected range (the threshold value set in the alert settings has been crossed).
Example: ping is by default a critical metric which is expected to be always 1 (reachable).
Default Metrics
Device Status
This metric stores the status of the device for viewing purposes.


Ping
measurement: |
ping |
types: |
int (reachable and loss), float (rtt) |
fields: |
reachable, loss, rtt_min, rtt_max, rtt_avg |
configuration: |
ping |
charts: |
uptime, packet_loss, rtt |
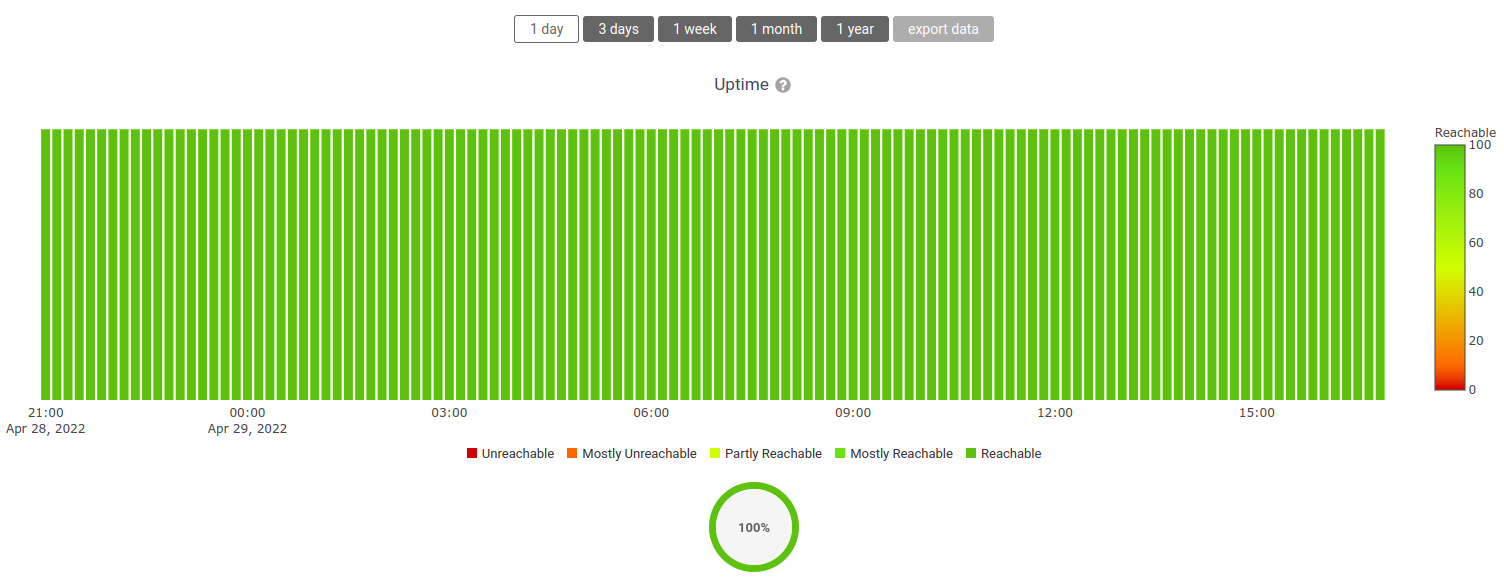
Uptime:
Packet loss:
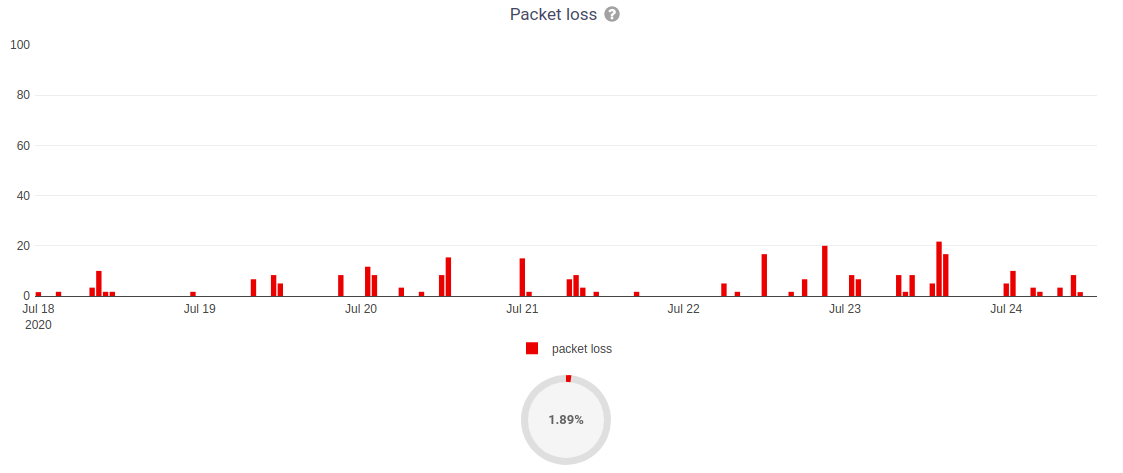
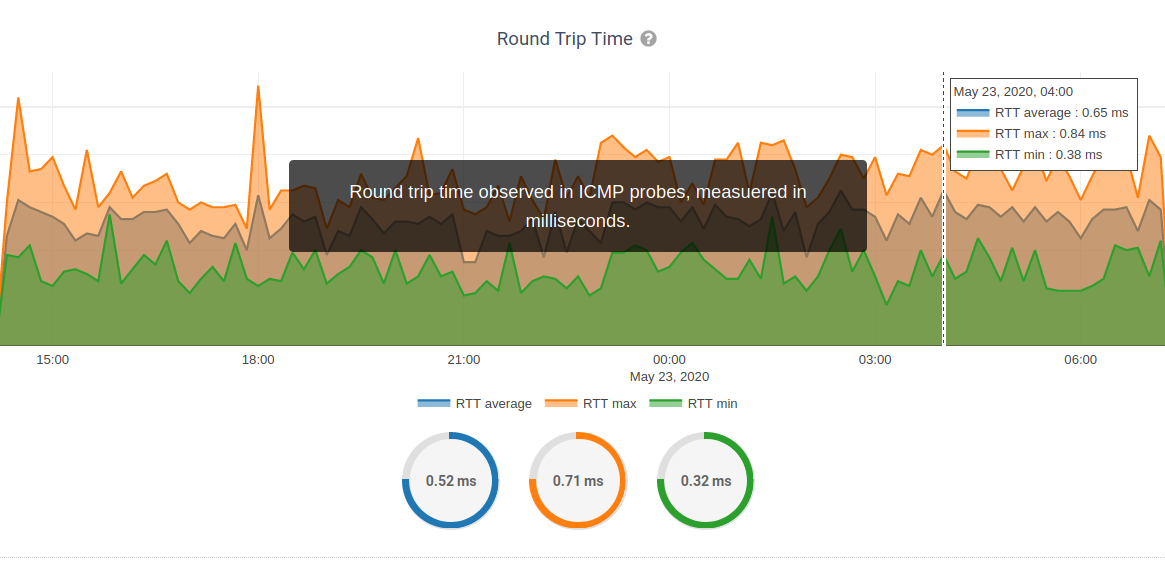
Round Trip Time:
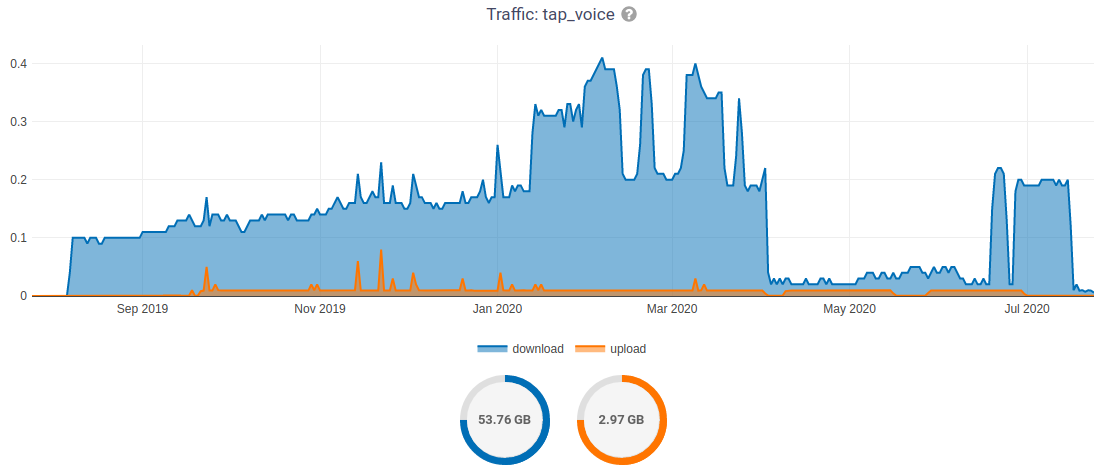
Traffic
measurement: |
traffic |
type: |
int |
fields: |
rx_bytes, tx_bytes |
tags: |
|
configuration: |
traffic |
charts: |
traffic |
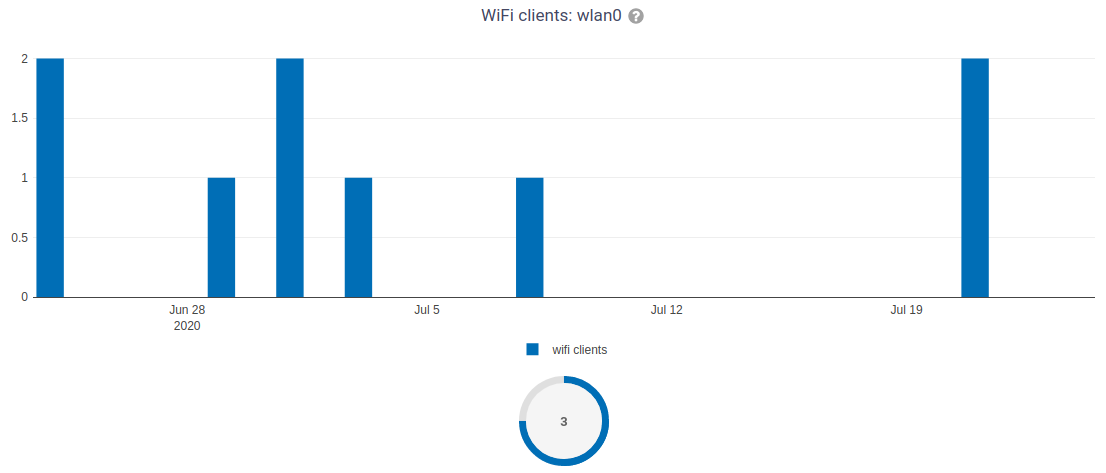
WiFi Clients
measurement: |
wifi_clients |
type: |
int |
fields: |
clients |
tags: |
|
configuration: |
clients |
charts: |
wifi_clients |
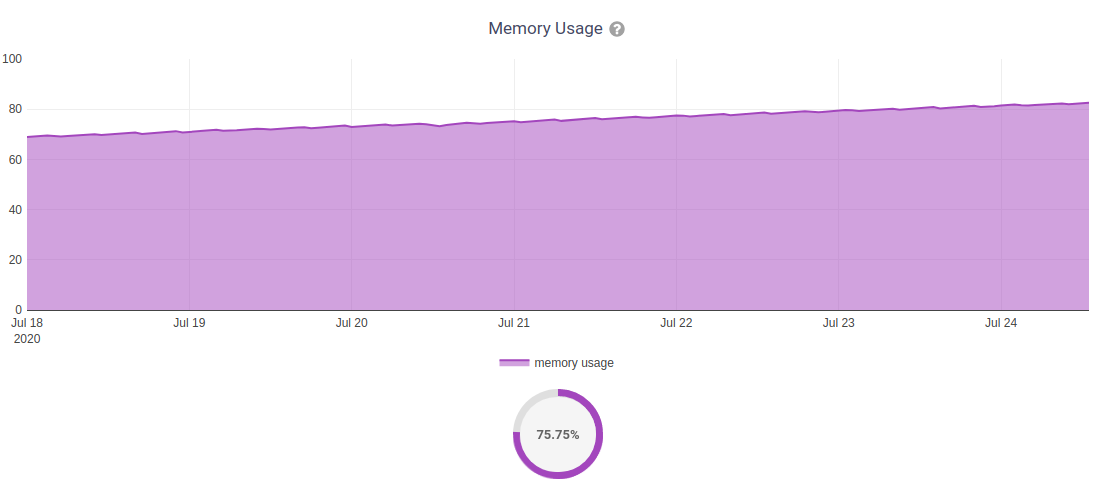
Memory Usage
measurement: |
<memory> |
type: |
float |
fields: |
percent_used, free_memory, total_memory, buffered_memory, shared_memory, cached_memory, available_memory |
configuration: |
memory |
charts: |
memory |
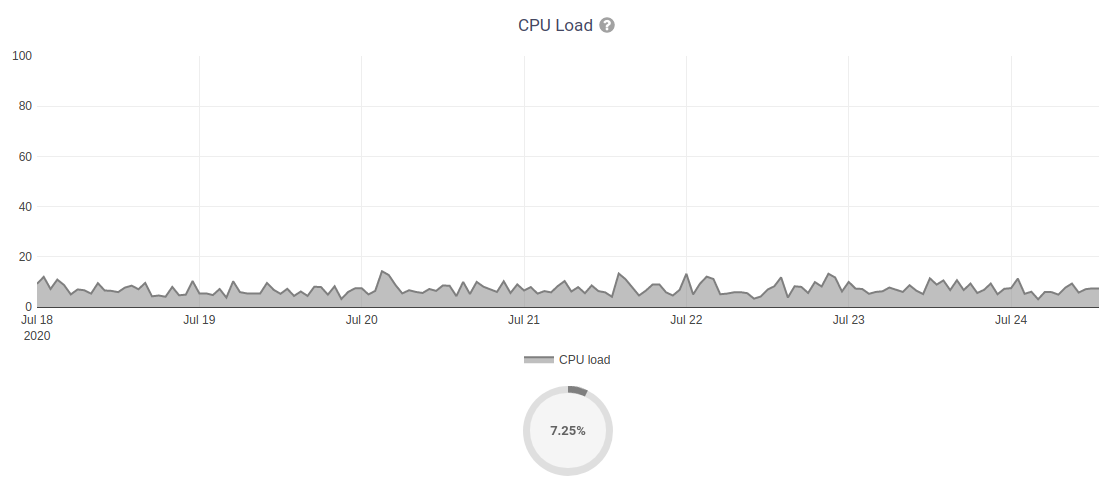
CPU Load
measurement: |
load |
type: |
float |
fields: |
cpu_usage, load_1, load_5, load_15 |
configuration: |
load |
charts: |
load |
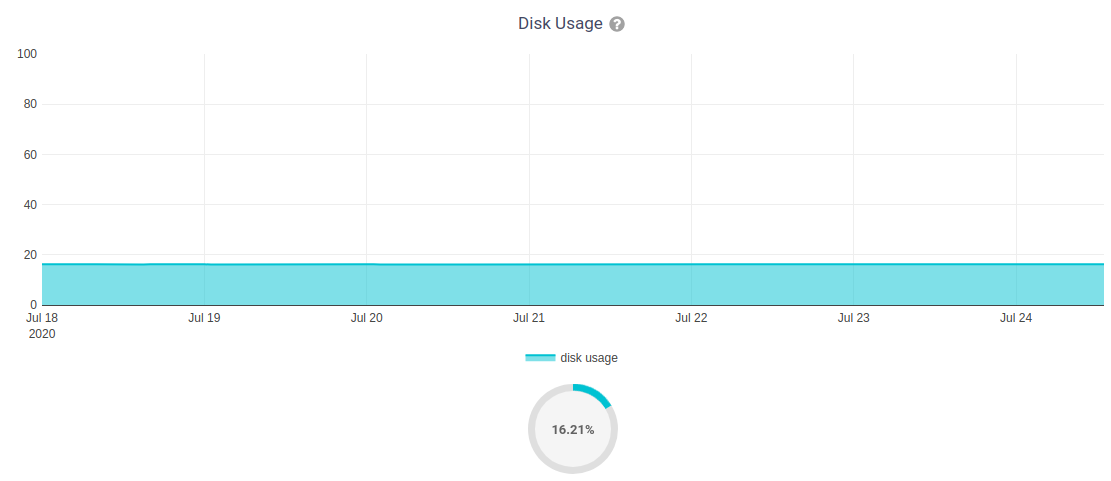
Disk Usage
measurement: |
disk |
type: |
float |
fields: |
used_disk |
configuration: |
disk |
charts: |
disk |
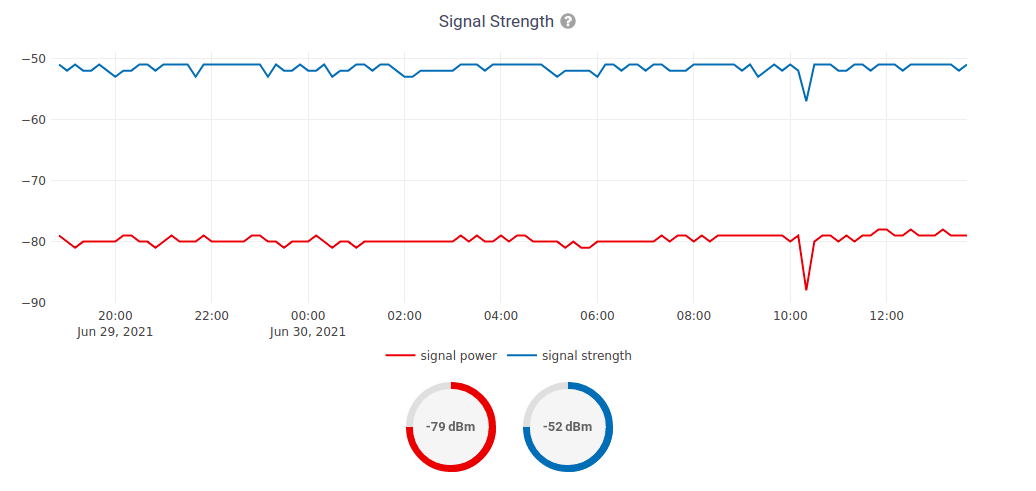
Mobile Signal Strength
measurement: |
signal_strength |
type: |
float |
fields: |
signal_strength, signal_power |
configuration: |
signal_strength |
charts: |
signal_strength |
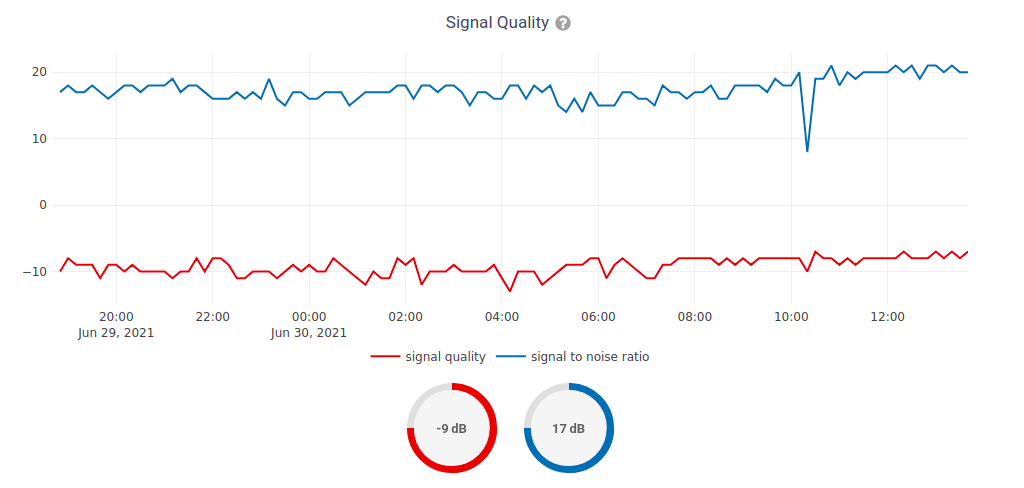
Mobile Signal Quality
measurement: |
signal_quality |
type: |
float |
fields: |
signal_quality, signal_quality |
configuration: |
signal_quality |
charts: |
signal_quality |
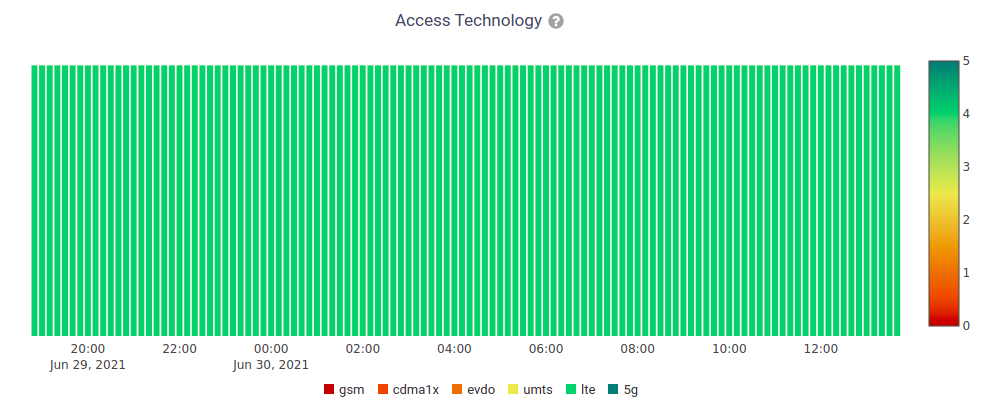
Mobile Access Technology in use
measurement: |
access_tech |
type: |
int |
fields: |
access_tech |
configuration: |
access_tech |
charts: |
access_tech |
Default Alerts / Notifications
Notification Type |
Use |
threshold_crossed |
Fires when a metric crosses the boundary defined in the threshold value of the alert settings. |
threshold_recovery |
Fires when a metric goes back within the expected range. |
connection_is_working |
Fires when the connection to a device is working. |
connection_is_not_working |
Fires when the connection (eg: SSH) to a device stops working (eg: credentials are outdated, management IP address is outdated, or device is not reachable). |
Available Checks
Ping
This check returns information on device uptime and RTT (Round trip time). The Charts uptime, packet loss and rtt are created. The fping command is used to collect these metrics. You may choose to disable auto creation of this check by setting OPENWISP_MONITORING_AUTO_PING to False.
You can change the default values used for ping checks using OPENWISP_MONITORING_PING_CHECK_CONFIG setting.
Configuration applied
This check ensures that the openwisp-config agent is running and applying configuration changes in a timely manner. You may choose to disable auto creation of this check by using the setting OPENWISP_MONITORING_AUTO_DEVICE_CONFIG_CHECK.
This check runs periodically, but it is also triggered whenever the configuration status of a device changes, this ensures the check reacts quickly to events happening in the network and informs the user promptly if there’s anything that is not working as intended.
Settings
OPENWISP_MONITORING_SHORT_RETENTION_POLICY
type: |
str |
default: |
24h0m0s |
The default retention policy used to store raw device data.
This data is only used to assess the recent status of devices, keeping it for a long time would not add much benefit and would cost a lot more in terms of disk space.
OPENWISP_MONITORING_AUTO_PING
type: |
bool |
default: |
True |
Whether ping checks are created automatically for devices.
OPENWISP_MONITORING_PING_CHECK_CONFIG
type: |
dict |
default: |
{} |
This setting allows to override the default ping check configuration defined in openwisp_monitoring.check.classes.ping.DEFAULT_PING_CHECK_CONFIG.
For example, if you want to change only the timeout of ping you can use:
OPENWISP_MONITORING_PING_CHECK_CONFIG = {
    'timeout': {
        'default': 1000,
    },
}
If you are overriding the default value for any parameter beyond the maximum or minimum value defined in openwisp_monitoring.check.classes.ping.DEFAULT_PING_CHECK_CONFIG, you will also need to override the maximum or minimum fields as following:
OPENWISP_MONITORING_PING_CHECK_CONFIG = {
    'timeout': {
        'default': 2000,
        'minimum': 1500,
        'maximum': 2500,
    },
}
Note: Above maximum and minimum values are only used for validating custom parameters of a Check object.
OPENWISP_MONITORING_AUTO_DEVICE_CONFIG_CHECK
type: |
bool |
default: |
True |
This setting allows you to choose whether config_applied checks should be created automatically for newly registered devices. It’s enabled by default.
OPENWISP_MONITORING_AUTO_CHARTS
type: |
list |
default: |
('traffic', 'wifi_clients', 'uptime', 'packet_loss', 'rtt') |
Automatically created charts.
OPENWISP_MONITORING_CRITICAL_DEVICE_METRICS
type: |
list of dict objects |
default: |
[{'key': 'ping', 'field_name': 'reachable'}] |
Device metrics that are considered critical:
when a value crosses the boundary defined in the “threshold value” field of the alert settings related to one of these metric types, the health status of the device related to the metric moves into CRITICAL.
By default, if devices are not reachable by pings they are flagged as CRITICAL.
OPENWISP_MONITORING_HEALTH_STATUS_LABELS
type: |
dict |
default: |
{'unknown': 'unknown', 'ok': 'ok', 'problem': 'problem', 'critical': 'critical'} |
This setting allows to change the health status labels, for example, if we want to use online instead of ok and offline instead of critical, you can use the following configuration:
OPENWISP_MONITORING_HEALTH_STATUS_LABELS = {
    'ok': 'online',
    'problem': 'problem',
    'critical': 'offline'
}
OPENWISP_MONITORING_MANAGEMENT_IP_ONLY
type: |
bool |
default: |
True |
By default, only the management IP will be used to perform active checks to the devices.
If the devices are connecting to your OpenWISP instance using a shared layer2 network, hence the OpenWSP server can reach the devices using the last_ip field, you can set this to False.
OPENWISP_MONITORING_DEVICE_RECOVERY_DETECTION
type: |
bool |
default: |
True |
When device recovery detection is enabled, recoveries are discovered as soon as a device contacts the openwisp system again (eg: to get the configuration checksum or to send monitoring metrics).
This feature is enabled by default.
If you use OpenVPN as the management VPN, you may want to check out a similar integration built in openwisp-network-topology: when the status of an OpenVPN link changes (detected by monitoring the status information of OpenVPN), the network topology module will trigger the monitoring checks. For more information see: Network Topology Device Integration
OPENWISP_MONITORING_MAC_VENDOR_DETECTION
type: |
bool |
default: |
True |
Indicates whether mac addresses will be complemented with hardware vendor information by performing lookups on the OUI (Organization Unique Identifier) table.
This feature is enabled by default.
OPENWISP_MONITORING_WRITE_RETRY_OPTIONS
type: |
dict |
default: |
see below |
# default value of OPENWISP_MONITORING_RETRY_OPTIONS:

dict(
    max_retries=None,
    retry_backoff=True,
    retry_backoff_max=600,
    retry_jitter=True,
)
Retry settings for recoverable failures during metric writes.
By default if a metric write fails (eg: due to excessive load on timeseries database at that moment) then the operation will be retried indefinitely with an exponential random backoff and a maximum delay of 10 minutes.
This feature makes the monitoring system resilient to temporary outages and helps to prevent data loss.
For more information regarding these settings, consult the celery documentation regarding automatic retries for known errors.
OPENWISP_MONITORING_TIMESERIES_RETRY_OPTIONS
type: |
dict |
default: |
see below |
# default value of OPENWISP_MONITORING_RETRY_OPTIONS:

dict(
    max_retries=6,
    delay=2
)
On busy systems, communication with the timeseries DB can occasionally fail. The timeseries DB backend will retry on any exception according to these settings. The delay kicks in only after the third consecutive attempt.
This setting shall not be confused with OPENWISP_MONITORING_WRITE_RETRY_OPTIONS, which is used to configure the infinite retrying of the celery task which writes metric data to the timeseries DB, while OPENWISP_MONITORING_TIMESERIES_RETRY_OPTIONS deals with any other read/write operation on the timeseries DB which may fail.
However these retries are not handled by celery but are simple python loops, which will eventually give up if a problem persists.
OPENWISP_MONITORING_TIMESERIES_RETRY_DELAY
type: |
int |
default: |
2 |
This settings allow you to configure the retry delay time (in seconds) after 3 failed attempt in timeseries database.
This retry setting is used in retry mechanism to make the requests to the timeseries database resilient.
This setting is independent of celery retry settings.
OPENWISP_MONITORING_DASHBOARD_MAP
type: |
bool |
default: |
True |
Whether the geographic map in the dashboard is enabled or not. This feature provides a geographic map which shows the locations which have devices installed in and provides a visual representation of the monitoring status of the devices, this allows to get an overview of the network at glance.
This feature is enabled by default and depends on the setting OPENWISP_ADMIN_DASHBOARD_ENABLED from openwisp-utils being set to True (which is the default).
You can turn this off if you do not use the geographic features of OpenWISP.
OPENWISP_MONITORING_METRICS
type: |
dict |
default: |
{} |
This setting allows to define additional metric configuration or to override the default metric configuration defined in openwisp_monitoring.monitoring.configuration.DEFAULT_METRICS.
For example, if you want to change only the field_name of clients metric to wifi_clients you can use:
from django.utils.translation import gettext_lazy as _

OPENWISP_MONITORING_METRICS = {
    'clients': {
        'label': _('WiFi clients'),
        'field_name': 'wifi_clients',
    },
}
For example, if you want to change only the default alert settings of memory metric you can use:
OPENWISP_MONITORING_METRICS = {
    'memory': {
        'alert_settings': {'threshold': 75, 'tolerance': 10}
    },
}
For example, if you want to change only the notification of config_applied metric you can use:
from django.utils.translation import gettext_lazy as _

OPENWISP_MONITORING_METRICS = {
    'config_applied': {
        'notification': {
            'problem': {
                'verbose_name': 'Configuration PROBLEM',
                'verb': _('has not been applied'),
                'email_subject': _(
                    '[{site.name}] PROBLEM: {notification.target} configuration '
                    'status issue'
                ),
                'message': _(
                    'The configuration for device [{notification.target}]'
                    '({notification.target_link}) {notification.verb} in a timely manner.'
                ),
            },
            'recovery': {
                'verbose_name': 'Configuration RECOVERY',
                'verb': _('configuration has been applied again'),
                'email_subject': _(
                    '[{site.name}] RECOVERY: {notification.target} {notification.verb} '
                    'successfully'
                ),
                'message': _(
                    'The device [{notification.target}]({notification.target_link}) '
                    '{notification.verb} successfully.'
                ),
            },
        },
    },
}
Or if you want to define a new metric configuration, which you can then call in your custom code (eg: a custom check class), you can do so as follows:
from django.utils.translation import gettext_lazy as _

OPENWISP_MONITORING_METRICS = {
    'top_fields_mean': {
        'name': 'Top Fields Mean',
        'key': '{key}',
        'field_name': '{field_name}',
        'label': '_(Top fields mean)',
        'related_fields': ['field1', 'field2', 'field3'],
    },
}
OPENWISP_MONITORING_CHARTS
type: |
dict |
default: |
{} |
This setting allows to define additional charts or to override the default chart configuration defined in openwisp_monitoring.monitoring.configuration.DEFAULT_CHARTS.
For example, if you want to change the traffic chart to show MB (megabytes) instead of GB (Gigabytes) you can use:
OPENWISP_MONITORING_CHARTS = {
    'traffic': {
        'unit': ' MB',
        'description': (
            'Network traffic, download and upload, measured on '
            'the interface "{metric.key}", measured in MB.'
        ),
        'query': {
            'influxdb': (
                "SELECT SUM(tx_bytes) / 1000000 AS upload, "
                "SUM(rx_bytes) / 1000000 AS download FROM {key} "
                "WHERE time >= '{time}' AND content_type = '{content_type}' "
                "AND object_id = '{object_id}' GROUP BY time(1d)"
            )
        },
    }
}
Or if you want to define a new chart configuration, which you can then call in your custom code (eg: a custom check class), you can do so as follows:
from django.utils.translation import gettext_lazy as _

OPENWISP_MONITORING_CHARTS = {
    'ram': {
        'type': 'line',
        'title': 'RAM usage',
        'description': 'RAM usage',
        'unit': 'bytes',
        'order': 100,
        'query': {
            'influxdb': (
                "SELECT MEAN(total) AS total, MEAN(free) AS free, "
                "MEAN(buffered) AS buffered FROM {key} WHERE time >= '{time}' AND "
                "content_type = '{content_type}' AND object_id = '{object_id}' "
                "GROUP BY time(1d)"
            )
        },
    }
}
In case you just want to change the colors used in a chart here’s how to do it:
OPENWISP_MONITORING_CHARTS = {
    'traffic': {
        'colors': ['#000000', '#cccccc']
    }
}
OPENWISP_MONITORING_AUTO_CLEAR_MANAGEMENT_IP
type: |
bool |
default: |
True |
This setting allows you to automatically clear management_ip of a device when it goes offline. It is enabled by default.
OPENWISP_MONITORING_API_URLCONF
type: |
string |
default: |
None |
Changes the urlconf option of django urls to point the monitoring API urls to another installed module, example, myapp.urls. (Useful when you have a seperate API instance.)
OPENWISP_MONITORING_API_BASEURL
type: |
string |
default: |
None |
If you have a seperate server for API of openwisp-monitoring on a different domain, you can use this option to change the base of the url, this will enable you to point all the API urls to your openwisp-monitoring API server’s domain, example: https://mymonitoring.myapp.com.
Registering / Unregistering Metric Configuration
OpenWISP Monitoring provides registering and unregistering metric configuration through utility functions openwisp_monitoring.monitoring.configuration.register_metric and openwisp_monitoring.monitoring.configuration.unregister_metric. Using these functions you can register or unregister metric configurations from anywhere in your code.
register_metric
This function is used to register a new metric configuration from anywhere in your code.
Parameter |
Description |
metric_name: |
A str defining name of the metric configuration. |
metric_configuration: |
A dict defining configuration of the metric. |
An example usage has been shown below.
from django.utils.translation import gettext_lazy as _
from openwisp_monitoring.monitoring.configuration import register_metric

# Define configuration of your metric
metric_config = {
    'label': _('Ping'),
    'name': 'Ping',
    'key': 'ping',
    'field_name': 'reachable',
    'related_fields': ['loss', 'rtt_min', 'rtt_max', 'rtt_avg'],
    'charts': {
        'uptime': {
            'type': 'bar',
            'title': _('Uptime'),
            'description': _(
                'A value of 100% means reachable, 0% means unreachable, values in '
                'between 0% and 100% indicate the average reachability in the '
                'period observed. Obtained with the fping linux program.'
            ),
            'summary_labels': [_('Average uptime')],
            'unit': '%',
            'order': 200,
            'colorscale': {
                'max': 100,
                'min': 0,
                'label': _('Reachable'),
                'scale': [
                    [[0, '#c13000'],
                    [0.1,'cb7222'],
                    [0.5,'#deed0e'],
                    [0.9, '#7db201'],
                    [1, '#498b26']],
                ],
                'map': [
                   [100, '#498b26', _('Reachable')],
                   [90, '#7db201', _('Mostly Reachable')],
                   [50, '#deed0e', _('Partly Reachable')],
                   [10, '#cb7222', _('Mostly Unreachable')],
                   [None, '#c13000', _('Unreachable')],
                ],
                'fixed_value': 100,
            },
            'query': chart_query['uptime'],
        },
        'packet_loss': {
            'type': 'bar',
            'title': _('Packet loss'),
            'description': _(
                'Indicates the percentage of lost packets observed in ICMP probes. '
                'Obtained with the fping linux program.'
            ),
            'summary_labels': [_('Average packet loss')],
            'unit': '%',
            'colors': '#d62728',
            'order': 210,
            'query': chart_query['packet_loss'],
        },
        'rtt': {
            'type': 'scatter',
            'title': _('Round Trip Time'),
            'description': _(
                'Round trip time observed in ICMP probes, measuered in milliseconds.'
            ),
            'summary_labels': [
                _('Average RTT'),
                _('Average Max RTT'),
                _('Average Min RTT'),
            ],
            'unit': _(' ms'),
            'order': 220,
            'query': chart_query['rtt'],
        },
    },
    'alert_settings': {'operator': '<', 'threshold': 1, 'tolerance': 0},
    'notification': {
        'problem': {
            'verbose_name': 'Ping PROBLEM',
            'verb': 'cannot be reached anymore',
            'level': 'warning',
            'email_subject': _(
                '[{site.name}] {notification.target} is not reachable'
            ),
            'message': _(
                'The device [{notification.target}] {notification.verb} anymore by our ping '
                'messages.'
            ),
        },
        'recovery': {
            'verbose_name': 'Ping RECOVERY',
            'verb': 'has become reachable',
            'level': 'info',
            'email_subject': _(
                '[{site.name}] {notification.target} is reachable again'
            ),
            'message': _(
                'The device [{notification.target}] {notification.verb} again by our ping '
                'messages.'
            ),
        },
    },
}

# Register your custom metric configuration
register_metric('ping', metric_config)
The above example will register one metric configuration (named ping), three chart configurations (named rtt, packet_loss, uptime) as defined in the charts key, two notification types (named ping_recovery, ping_problem) as defined in notification key.
The AlertSettings of ping metric will by default use threshold and tolerance defined in the alert_settings key. You can always override them and define your own custom values via the admin.
Note: It will raise ImproperlyConfigured exception if a metric configuration is already registered with same name (not to be confused with verbose_name).
If you don’t need to register a new metric but need to change a specific key of an existing metric configuration, you can use OPENWISP_MONITORING_METRICS.
unregister_metric
This function is used to unregister a metric configuration from anywhere in your code.
Parameter |
Description |
metric_name: |
A str defining name of the metric configuration. |
An example usage is shown below.
from openwisp_monitoring.monitoring.configuration import unregister_metric

# Unregister previously registered metric configuration
unregister_metric('metric_name')Note: It will raise ImproperlyConfigured exception if the concerned metric configuration is not registered.
Registering / Unregistering Chart Configuration
OpenWISP Monitoring provides registering and unregistering chart configuration through utility functions openwisp_monitoring.monitoring.configuration.register_chart and openwisp_monitoring.monitoring.configuration.unregister_chart. Using these functions you can register or unregister chart configurations from anywhere in your code.
register_chart
This function is used to register a new chart configuration from anywhere in your code.
Parameter |
Description |
chart_name: |
A str defining name of the chart configuration. |
chart_configuration: |
A dict defining configuration of the chart. |
An example usage has been shown below.
from openwisp_monitoring.monitoring.configuration import register_chart

# Define configuration of your chart
chart_config = {
    'type': 'histogram',
    'title': 'Histogram',
    'description': 'Histogram',
    'top_fields': 2,
    'order': 999,
    'query': {
        'influxdb': (
            "SELECT {fields|SUM|/ 1} FROM {key} "
            "WHERE time >= '{time}' AND content_type = "
            "'{content_type}' AND object_id = '{object_id}'"
        )
    },
}

# Register your custom chart configuration
register_chart('chart_name', chart_config)Note: It will raise ImproperlyConfigured exception if a chart configuration is already registered with same name (not to be confused with verbose_name).
If you don’t need to register a new chart but need to change a specific key of an existing chart configuration, you can use OPENWISP_MONITORING_CHARTS.
unregister_chart
This function is used to unregister a chart configuration from anywhere in your code.
Parameter |
Description |
chart_name: |
A str defining name of the chart configuration. |
An example usage is shown below.
from openwisp_monitoring.monitoring.configuration import unregister_chart

# Unregister previously registered chart configuration
unregister_chart('chart_name')Note: It will raise ImproperlyConfigured exception if the concerned chart configuration is not registered.
Registering new notification types
You can define your own notification types using register_notification_type function from OpenWISP Notifications. For more information, see the relevant openwisp-notifications section about registering notification types.
Once a new notification type is registered, you have to use the “notify” signal provided in openwisp-notifications to send notifications for this type.
Exceptions
TimeseriesWriteException
Path: openwisp_monitoring.db.exceptions.TimeseriesWriteException
If there is any failure due while writing data in timeseries database, this exception shall be raised with a helpful error message explaining the cause of the failure. This exception will normally be caught and the failed write task will be retried in the background so that there is no loss of data if failures occur due to overload of Timeseries server. You can read more about this retry mechanism at OPENWISP_MONITORING_WRITE_RETRY_OPTIONS.
InvalidMetricConfigException
Path: openwisp_monitoring.monitoring.exceptions.InvalidMetricConfigException
This exception shall be raised if the metric configuration is broken.
InvalidChartConfigException
Path: openwisp_monitoring.monitoring.exceptions.InvalidChartConfigException
This exception shall be raised if the chart configuration is broken.
Rest API
Live documentation
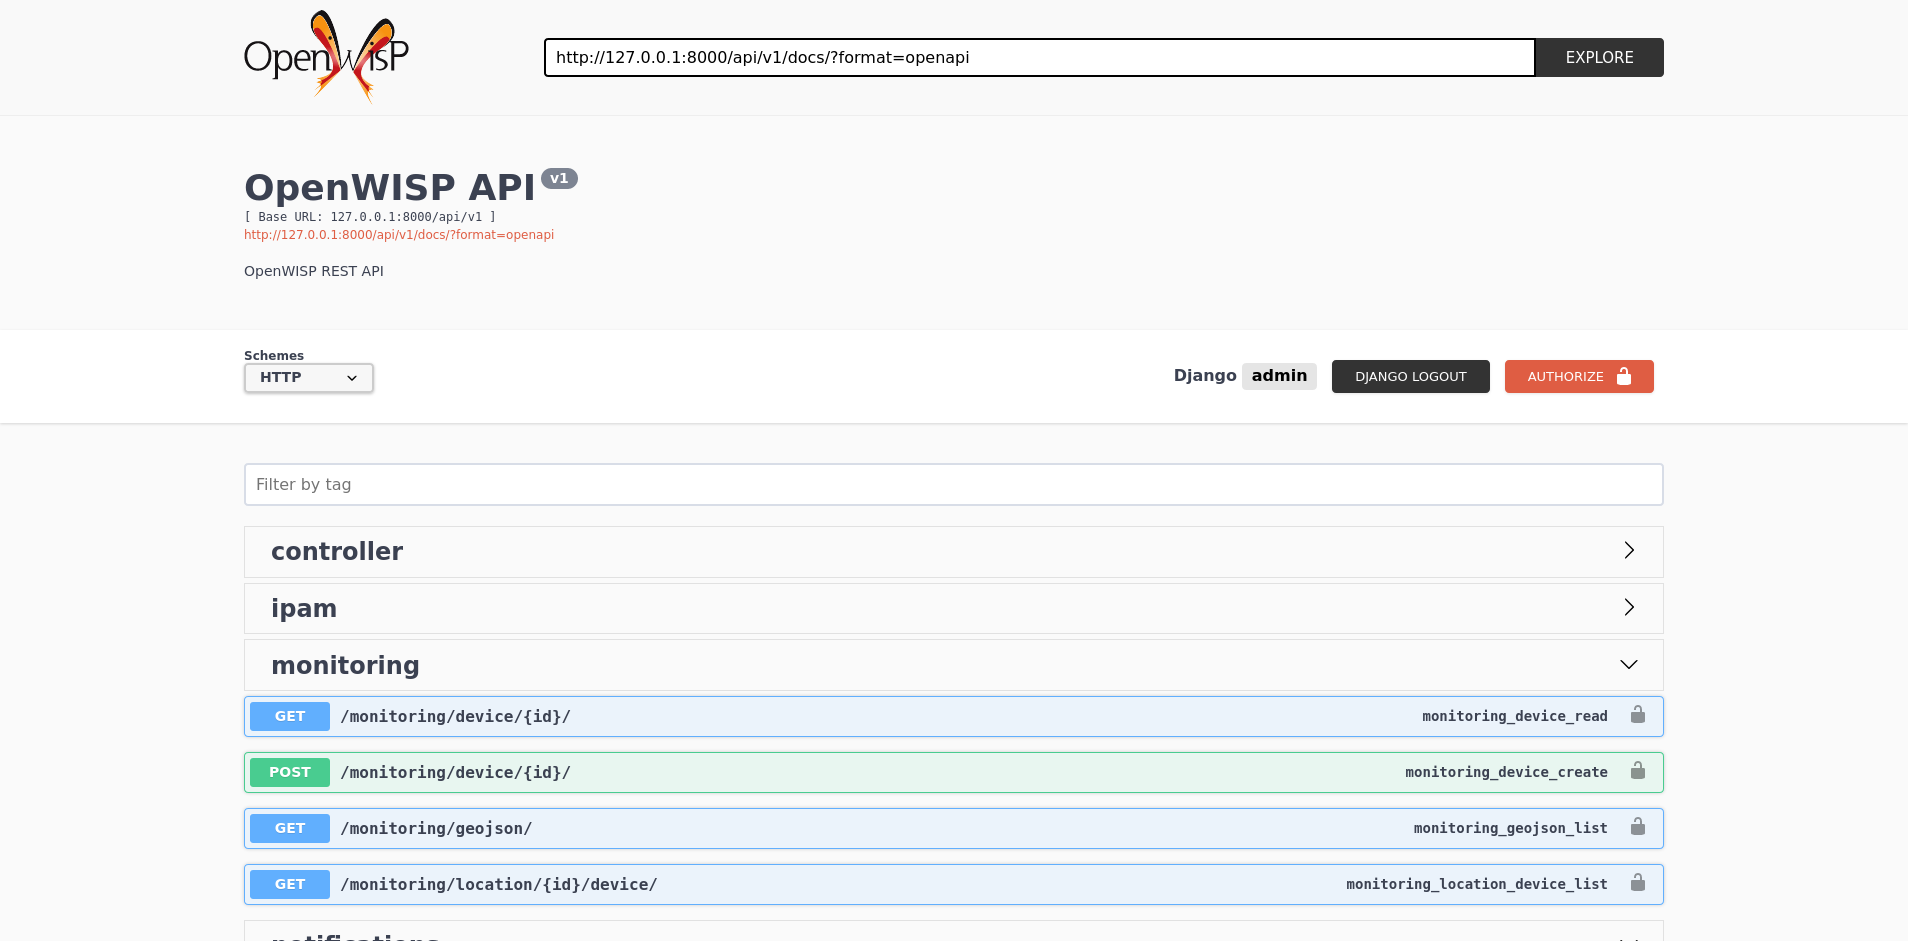
A general live API documentation (following the OpenAPI specification) at /api/v1/docs/.
Browsable web interface
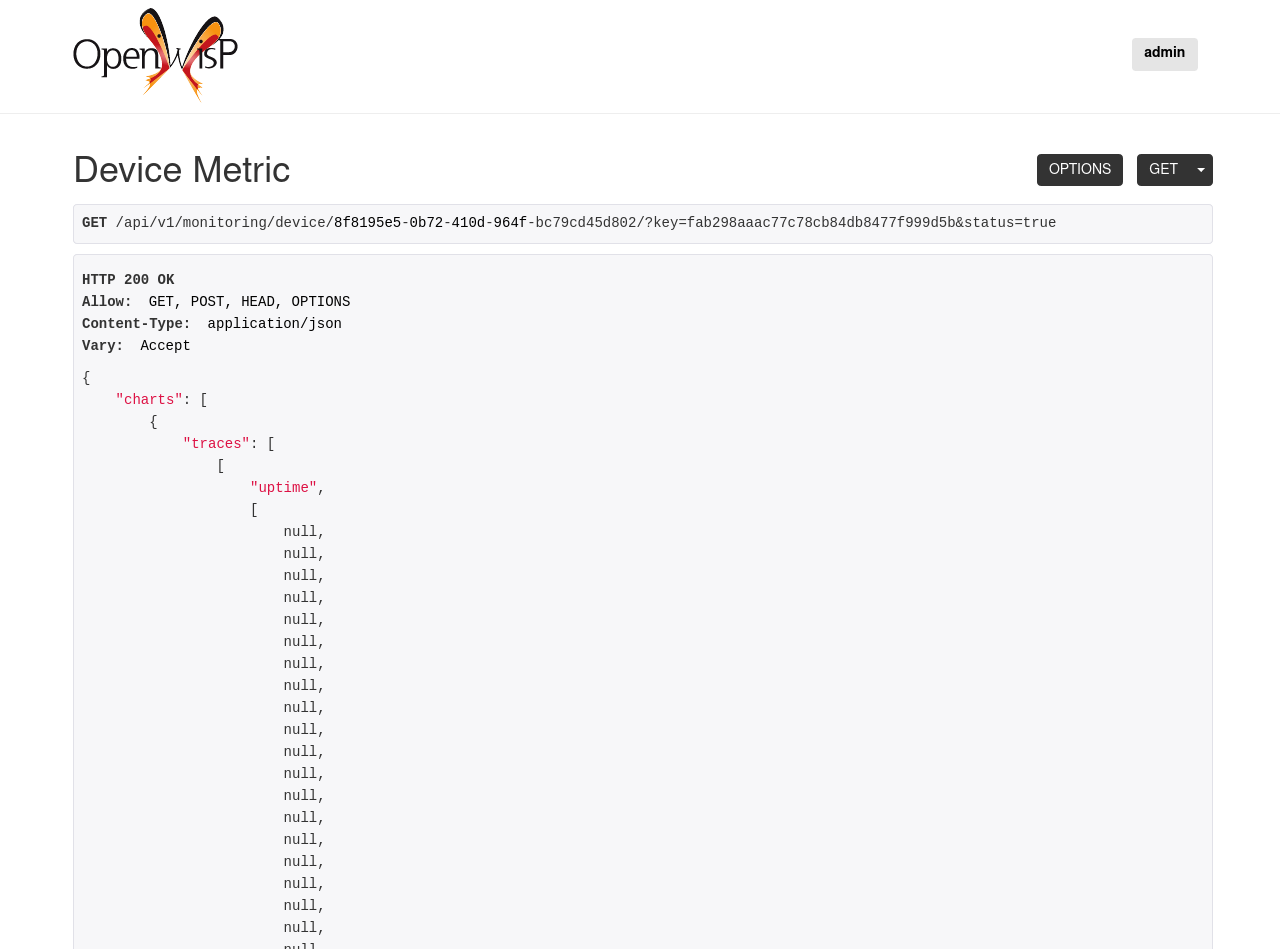
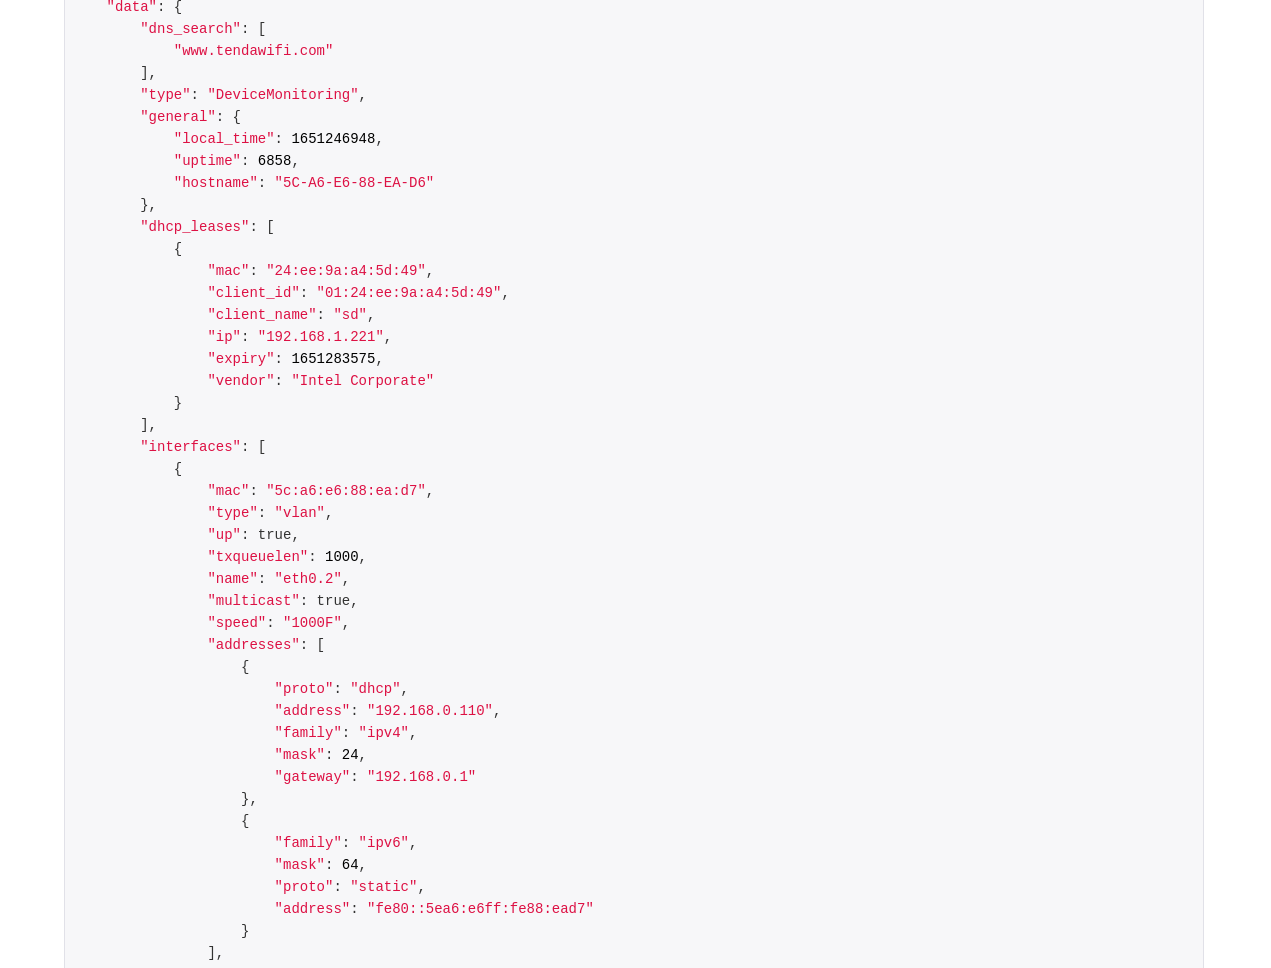
Additionally, opening any of the endpoints listed below directly in the browser will show the browsable API interface of Django-REST-Framework, which makes it even easier to find out the details of each endpoint.
List of endpoints
Since the detailed explanation is contained in the Live documentation and in the Browsable web page of each point, here we’ll provide just a list of the available endpoints, for further information please open the URL of the endpoint in your browser.
Retrieve device charts and device status data
GET /v1/monitoring/device/{pk}/?key={key}&status=trueThe format used for Device Status is inspired by NetJSON DeviceMonitoring.
Note: If the request is made without ?status=true then only device charts data would be returned.
Collect device metrics and status
POST /v1/monitoring/device/{pk}/?key={key}&time={time}If data is latest then an additional parameter current can also be passed. For e.g.:
POST /v1/monitoring/device/{pk}/?key={key}&time={time}¤t=trueThe format used for Device Status is inspired by NetJSON DeviceMonitoring.
Note: Device data will be saved with in timeseries database with the specified time, this should be in the format %d-%m-%Y_%H:%M:%S.%f, otherwise 400 Bad Response will be returned.
If the request is made without passing the time argument, the server local time will be used.
The time parameter was added to support resilient collection and sending of data by the OpenWISP Monitoring Agent.
Signals
device_metrics_received
Path: openwisp_monitoring.device.signals.device_metrics_received
Arguments:
instance: instance of Device whose metrics have been received
request: the HTTP request object
time: time with which metrics will be saved. If none, then server time will be used
current: whether the data has just been collected or was collected previously and sent now due to network connectivity issues
This signal is emitted when device metrics are received to the DeviceMetric view (only when using HTTP POST).
The signal is emitted just before a successful response is returned, it is not sent if the response was not successful.
health_status_changed
Path: openwisp_monitoring.device.signals.health_status_changed
Arguments:
instance: instance of DeviceMonitoring whose status has been changed
status: the status by which DeviceMonitoring’s existing status has been updated with
This signal is emitted only if the health status of DeviceMonitoring object gets updated.
threshold_crossed
Path: openwisp_monitoring.monitoring.signals.threshold_crossed
Arguments:
metric: Metric object whose threshold defined in related alert settings was crossed
alert_settings: AlertSettings related to the Metric
target: related Device object
first_time: it will be set to true when the metric is written for the first time. It shall be set to false afterwards.
tolerance_crossed: it will be set to true if the metric has crossed the threshold for tolerance configured in alert settings. Otherwise, it will be set to false.
first_time parameter can be used to avoid initiating unneeded actions. For example, sending recovery notifications.
This signal is emitted when the threshold value of a Metric defined in alert settings is crossed.
pre_metric_write
Path: openwisp_monitoring.monitoring.signals.pre_metric_write
Arguments:
metric: Metric object whose data shall be stored in timeseries database
values: metric data that shall be stored in the timeseries database
time: time with which metrics will be saved
current: whether the data has just been collected or was collected previously and sent now due to network connectivity issues
This signal is emitted for every metric before the write operation is sent to the timeseries database.
post_metric_write
Path: openwisp_monitoring.monitoring.signals.post_metric_write
Arguments:
metric: Metric object whose data is being stored in timeseries database
values: metric data that is being stored in the timeseries database
time: time with which metrics will be saved
current: whether the data has just been collected or was collected previously and sent now due to network connectivity issues
This signal is emitted for every metric after the write operation is successfully executed in the background.
Management commands
run_checks
This command will execute all the available checks for all the devices. By default checks are run periodically by celery beat. You can learn more about this in Setup.
Example usage:
cd tests/
./manage.py run_checks
migrate_timeseries
This command triggers asynchronous migration of the time-series database.
Example usage:
cd tests/
./manage.py migrate_timeseries
Monitoring scripts
Monitoring scripts are now deprecated in favour of monitoring packages. Follow the migration guide in Migrating from monitoring scripts to monitoring packages section of this documentation.
Migrating from monitoring scripts to monitoring packages
This section is intended for existing users of openwisp-monitoring. The older version of openwisp-monitoring used monitoring scripts that are now deprecated in favour of monitoring packages.
If you already had a monitoring template created on your installation, then the migrations of openwisp-monitoring will update that template by making the following changes:
The file name of all scripts will be appended with legacy- keyword in order to differentiate them from the scripts bundled with the new packages.
The /usr/sbin/legacy-openwisp-monitoring (previously /usr/sbin/openwisp-monitoring) script will be updated to exit if openwisp-monitoring package is installed on the device.
Install the monitoring packages as mentioned in the Install monitoring packages on device section of this documentation.
After the proper configuration of the openwisp-monitoring package on your device, you can remove the monitoring template from your devices.
We suggest removing the monitoring template from the devices one at a time instead of deleting the template. This ensures the correctness of openwisp monitoring package configuration and you’ll not miss out on any monitoring data.
Note: If you have made changes to the default monitoring template created by openwisp-monitoring or you are using custom monitoring templates, then you should remove such templates from the device before installing the monitoring packages.
Extending openwisp-monitoring
One of the core values of the OpenWISP project is Software Reusability, for this reason openwisp-monitoring provides a set of base classes which can be imported, extended and reused to create derivative apps.
In order to implement your custom version of openwisp-monitoring, you need to perform the steps described in the rest of this section.
When in doubt, the code in the test project and the sample apps namely sample_check, sample_monitoring, sample_device_monitoring will guide you in the correct direction: just replicate and adapt that code to get a basic derivative of openwisp-monitoring working.
Premise: if you plan on using a customized version of this module, we suggest to start with it since the beginning, because migrating your data from the default module to your extended version may be time consuming.
1. Initialize your custom module
The first thing you need to do in order to extend any openwisp-monitoring app is create a new django app which will contain your custom version of that openwisp-monitoring app.
A django app is nothing more than a python package (a directory of python scripts), in the following examples we’ll call these django apps as mycheck, mydevicemonitoring, mymonitoring but you can name it how you want:
django-admin startapp mycheck
django-admin startapp mydevicemonitoring
django-admin startapp mymonitoring
Keep in mind that the command mentioned above must be called from a directory which is available in your PYTHON_PATH so that you can then import the result into your project.
Now you need to add mycheck to INSTALLED_APPS in your settings.py, ensuring also that openwisp_monitoring.check has been removed:
INSTALLED_APPS = [
    # ... other apps ...
    # 'openwisp_monitoring.check',        <-- comment out or delete this line
    # 'openwisp_monitoring.device',       <-- comment out or delete this line
    # 'openwisp_monitoring.monitoring'    <-- comment out or delete this line
    'mycheck',
    'mydevicemonitoring',
    'mymonitoring',
    'nested_admin',
]
For more information about how to work with django projects and django apps, please refer to the “Tutorial: Writing your first Django app” in the django docunmentation.
2. Install openwisp-monitoring
Install (and add to the requirement of your project) openwisp-monitoring:
pip install --U https://github.com/openwisp/openwisp-monitoring/tarball/master
3. Add EXTENDED_APPS
Add the following to your settings.py:
EXTENDED_APPS = ['device_monitoring', 'monitoring', 'check']4. Add openwisp_utils.staticfiles.DependencyFinder
Add openwisp_utils.staticfiles.DependencyFinder to STATICFILES_FINDERS in your settings.py:
STATICFILES_FINDERS = [
    'django.contrib.staticfiles.finders.FileSystemFinder',
    'django.contrib.staticfiles.finders.AppDirectoriesFinder',
    'openwisp_utils.staticfiles.DependencyFinder',
]
5. Add openwisp_utils.loaders.DependencyLoader
Add openwisp_utils.loaders.DependencyLoader to TEMPLATES in your settings.py:
TEMPLATES = [
    {
        'BACKEND': 'django.template.backends.django.DjangoTemplates',
        'OPTIONS': {
            'loaders': [
                'django.template.loaders.filesystem.Loader',
                'django.template.loaders.app_directories.Loader',
                'openwisp_utils.loaders.DependencyLoader',
            ],
            'context_processors': [
                'django.template.context_processors.debug',
                'django.template.context_processors.request',
                'django.contrib.auth.context_processors.auth',
                'django.contrib.messages.context_processors.messages',
            ],
        },
    }
]
6. Inherit the AppConfig class
Please refer to the following files in the sample app of the test project:
For more information regarding the concept of AppConfig please refer to the “Applications” section in the django documentation.
7. Create your custom models
To extend check app, refer to sample_check models.py file.
To extend monitoring app, refer to sample_monitoring models.py file.
To extend device_monitoring app, refer to sample_device_monitoring models.py file.
Note:
For doubts regarding how to use, extend or develop models please refer to the “Models” section in the django documentation.
For doubts regarding proxy models please refer to proxy models.
8. Add swapper configurations
Add the following to your settings.py:
# Setting models for swapper module
# For extending check app
CHECK_CHECK_MODEL = 'YOUR_MODULE_NAME.Check'
# For extending monitoring app
MONITORING_CHART_MODEL = 'YOUR_MODULE_NAME.Chart'
MONITORING_METRIC_MODEL = 'YOUR_MODULE_NAME.Metric'
MONITORING_ALERTSETTINGS_MODEL = 'YOUR_MODULE_NAME.AlertSettings'
# For extending device_monitoring app
DEVICE_MONITORING_DEVICEDATA_MODEL = 'YOUR_MODULE_NAME.DeviceData'
DEVICE_MONITORING_DEVICEMONITORING_MODEL = 'YOUR_MODULE_NAME.DeviceMonitoring'
Substitute <YOUR_MODULE_NAME> with your actual django app name (also known as app_label).
9. Create database migrations
Create and apply database migrations:
./manage.py makemigrations
./manage.py migrate
For more information, refer to the “Migrations” section in the django documentation.
10. Create your custom admin
To extend check app, refer to sample_check admin.py file.
To extend monitoring app, refer to sample_monitoring admin.py file.
To extend device_monitoring app, refer to sample_device_monitoring admin.py file.
To introduce changes to the admin, you can do it in the two ways described below.
Note: for doubts regarding how the django admin works, or how it can be customized, please refer to “The django admin site” section in the django documentation.
1. Monkey patching
If the changes you need to add are relatively small, you can resort to monkey patching.
For example, for check app you can do it as:
from openwisp_monitoring.check.admin import CheckAdmin

CheckAdmin.list_display.insert(1, 'my_custom_field')
CheckAdmin.ordering = ['-my_custom_field']
Similarly for device_monitoring app, you can do it as:
from openwisp_monitoring.device.admin import DeviceAdmin

DeviceAdmin.list_display.insert(1, 'my_custom_field')
DeviceAdmin.ordering = ['-my_custom_field']
Similarly for monitoring app, you can do it as:
from openwisp_monitoring.monitoring.admin import MetricAdmin, AlertSettingsAdmin

MetricAdmin.list_display.insert(1, 'my_custom_field')
MetricAdmin.ordering = ['-my_custom_field']
AlertSettingsAdmin.list_display.insert(1, 'my_custom_field')
AlertSettingsAdmin.ordering = ['-my_custom_field']
2. Inheriting admin classes
If you need to introduce significant changes and/or you don’t want to resort to monkey patching, you can proceed as follows:
For check app,
from django.contrib import admin

from openwisp_monitoring.check.admin import CheckAdmin as BaseCheckAdmin
from swapper import load_model

Check = load_model('check', 'Check')

admin.site.unregister(Check)

@admin.register(Check)
class CheckAdmin(BaseCheckAdmin):
    # add your changes here
For device_monitoring app,
from django.contrib import admin

from openwisp_monitoring.device_monitoring.admin import DeviceAdmin as BaseDeviceAdmin
from swapper import load_model

Device = load_model('config', 'Device')

admin.site.unregister(Device)

@admin.register(Device)
class DeviceAdmin(BaseDeviceAdmin):
    # add your changes here
For monitoring app,
from django.contrib import admin

from openwisp_monitoring.monitoring.admin import (
    AlertSettingsAdmin as BaseAlertSettingsAdmin,
    MetricAdmin as BaseMetricAdmin
)
from swapper import load_model

Metric = load_model('Metric')
AlertSettings = load_model('AlertSettings')

admin.site.unregister(Metric)
admin.site.unregister(AlertSettings)

@admin.register(Metric)
class MetricAdmin(BaseMetricAdmin):
    # add your changes here

@admin.register(AlertSettings)
class AlertSettingsAdmin(BaseAlertSettingsAdmin):
    # add your changes here
11. Create root URL configuration
Please refer to the urls.py file in the test project.
For more information about URL configuration in django, please refer to the “URL dispatcher” section in the django documentation.
12. Create celery.py
Please refer to the celery.py file in the test project.
For more information about the usage of celery in django, please refer to the “First steps with Django” section in the celery documentation.
13. Import Celery Tasks
Add the following in your settings.py to import celery tasks from device_monitoring app.
CELERY_IMPORTS = ('openwisp_monitoring.device.tasks',)14. Create the custom command run_checks
Please refer to the run_checks.py file in the test project.
For more information about the usage of custom management commands in django, please refer to the “Writing custom django-admin commands” section in the django documentation.
15. Import the automated tests
When developing a custom application based on this module, it’s a good idea to import and run the base tests too, so that you can be sure the changes you’re introducing are not breaking some of the existing features of openwisp-monitoring.
In case you need to add breaking changes, you can overwrite the tests defined in the base classes to test your own behavior.
For, extending check app see the tests of sample_check app to find out how to do this.
For, extending device_monitoring app see the tests of sample_device_monitoring app to find out how to do this.
For, extending monitoring app see the tests of sample_monitoring app to find out how to do this.
Other base classes that can be inherited and extended
The following steps are not required and are intended for more advanced customization.
DeviceMetricView
This view is responsible for displaying Charts and Status primarily.
The full python path is: openwisp_monitoring.device.api.views.DeviceMetricView.
If you want to extend this view, you will have to perform the additional steps below.
Step 1. Import and extend view:
# mydevice/api/views.py
from openwisp_monitoring.device.api.views import (
    DeviceMetricView as BaseDeviceMetricView
)

class DeviceMetricView(BaseDeviceMetricView):
    # add your customizations here ...
    pass
Step 2: remove the following line from your root urls.py file:
re_path(
    'api/v1/monitoring/device/(?P<pk>[^/]+)/$',
    views.device_metric,
    name='api_device_metric',
),
Step 3: add an URL route pointing to your custom view in urls.py file:
# urls.py
from mydevice.api.views import DeviceMetricView

urlpatterns = [
    # ... other URLs
    re_path(r'^(?P<path>.*)$', DeviceMetricView.as_view(), name='api_device_metric',),
]
Contributing
Please refer to the OpenWISP contributing guidelines.
Project details
Download files
Download the file for your platform. If you're not sure which to choose, learn more about installing packages.
Source Distribution
Built Distribution
File details
Details for the file openwisp-monitoring-1.0.tar.gz.
File metadata
- Download URL: openwisp-monitoring-1.0.tar.gz
- Upload date:
- Size: 529.7 kB
- Tags: Source
- Uploaded using Trusted Publishing? No
- Uploaded via: twine/3.2.0 pkginfo/1.5.0.1 requests/2.27.1 setuptools/59.6.0 requests-toolbelt/0.9.1 tqdm/4.48.2 CPython/3.8.10
File hashes
| Algorithm | Hash digest | |
|---|---|---|
| SHA256 | 7346cbeaa18c7a7d0f31c938e6199ce37758c7f4e707f0c3490b8e6405f6979f |
|
| MD5 | 69bd2a5154a12b6cb33b0b8f1e9ccd36 |
|
| BLAKE2b-256 | aba634a985077fe5aed1175e4bdfae86827b92f234e51c4b4fc19bb7eac6a4ce |
File details
Details for the file openwisp_monitoring-1.0-py2.py3-none-any.whl.
File metadata
- Download URL: openwisp_monitoring-1.0-py2.py3-none-any.whl
- Upload date:
- Size: 537.7 kB
- Tags: Python 2, Python 3
- Uploaded using Trusted Publishing? No
- Uploaded via: twine/3.2.0 pkginfo/1.5.0.1 requests/2.27.1 setuptools/59.6.0 requests-toolbelt/0.9.1 tqdm/4.48.2 CPython/3.8.10
File hashes
| Algorithm | Hash digest | |
|---|---|---|
| SHA256 | 87e52f45b5659e161a4abaa009332f351d89966d1aa391a31caf3660b2f7c005 |
|
| MD5 | aeb056825ddbb02a8721b1283d64b96d |
|
| BLAKE2b-256 | e6aa22fdb39ac15cf413f66b1a4d7f670f6ecd5b529718d8acf7aea8855096eb |


