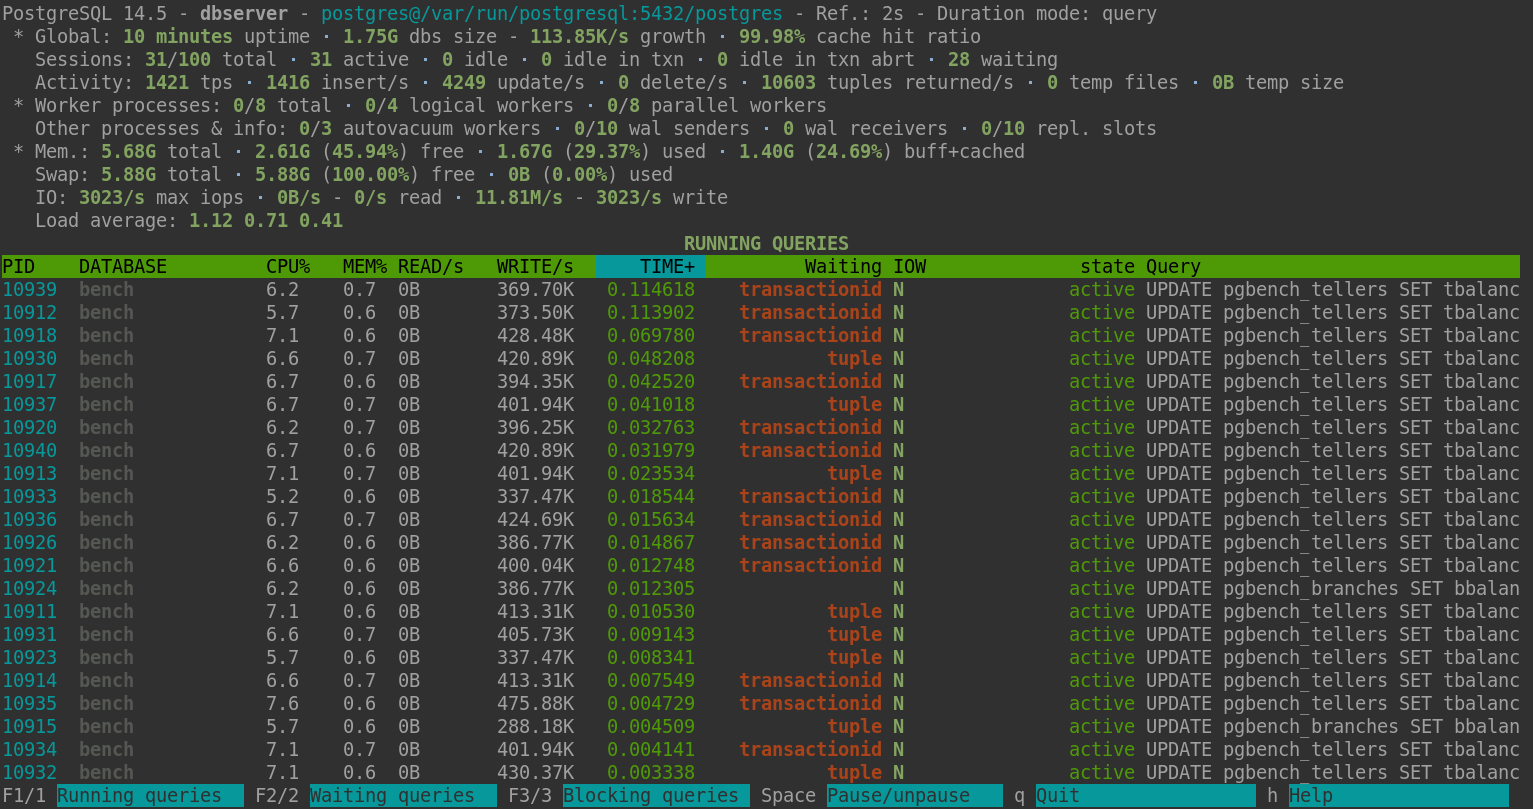
Command line tool for PostgreSQL server activity monitoring.
Project description
Command line tool for PostgreSQL server activity monitoring.
Installation
pg_activity requires Python 3.6 or later. It can be installed using pip
(available, e.g., as apt install python3-pip on Debian-based distributions):
$ python3 -m pip install pg_activity psycopg2-binary
or directly from your Linux distribution, if available, e.g.:
$ sudo apt install pg-activity
Usage
pg_activity works locally or remotely. In local execution context, to obtain
sufficient rights to display system informations, the system user running
pg_activity must be the same user running postgresql server (postgres by
default), or have more rights like root. Otherwise, pg_activity can fallback
to a degraded mode without displaying system informations. On the same way,
PostgreSQL user used to connect to the database must be super-user.
ex:
sudo -u postgres pg_activity -U postgres
Options
pg_activity [options]

Options:
    --version             Show program's version number and exit
    -U USERNAME, --username=USERNAME
                          Database user name (default: "postgres").
    -p PORT, --port=PORT  Database server port (default: "5432").
    -h HOSTNAME, --host=HOSTNAME
                          Database server host or socket directory (default:
                          "localhost").
    -d DBNAME, --dbname=DBNAME
                          Database name to connect to (default: "postgres").
    --blocksize=BLOCKSIZE Filesystem blocksize (default: 4096).
    --rds                 Enable support for AWS RDS.
    --output=FILEPATH     Store running queries as CSV.
    --help                Show this help message and exit.
    --no-db-size          Skip total size of DB.
    --min-duration        Don't display queries with smaller than specified
                          duration (in seconds).
    --verbose-mode=VERBOSE_MODE
                          Queries display mode. Values: 1-TRUNCATED,
                          2-FULL(default), 3-INDENTED
    --duration-mode=DURATION_MODE
                          Duration mode. Values: 1-QUERY(default),
                          2-TRANSACTION, 3-BACKEND


Display options, you can exclude some columns by using them :
    --no-database         Disable DATABASE.
    --no-user             Disable USER.
    --no-client           Disable CLIENT.
    --no-cpu              Disable CPU%.
    --no-mem              Disable MEM%.
    --no-read             Disable READ/s.
    --no-write            Disable WRITE/s.
    --no-time             Disable TIME+.
    --no-wait             Disable W.
    --no-app-name         Disable App.
Notes
Length of SQL query text that pg_activity reports relies on PostgreSQL
parameter track_activity_query_size. Default value is 1024 (expressed in
bytes). If your SQL query text look truncated, you should increase
track_activity_query_size.
Interactives commands
| Key | Action |
|---|---|
r |
Sort by READ/s, descending |
w |
Sort by WRITE/s, descending |
c |
Sort by CPU%, descending |
m |
Sort by MEM%, descending |
t |
Sort by TIME+, descending |
T |
Change duration mode: query, transaction, backend |
Space |
Pause on/off |
v |
Change queries display mode: full, indented, truncated |
UP/DOWN |
Scroll processes list |
k/j |
Scroll processes list |
q |
Quit |
+ |
Increase refresh time. Maximum value : 5s |
- |
Decrease refresh time. Minimum Value : 0.5s |
F1/1 |
Running queries list |
F2/2 |
Waiting queries list |
F3/3 |
Blocking queries list |
h |
Help page |
R |
Refresh |
D |
Refresh Database Size (including when --no-dbzise option applied) |
Navigation mode
| Key | Action |
|---|---|
UP/k |
Move up the cursor |
DOWN/j |
Move down the cursor |
K |
Terminate the current backend/tagged backends |
C |
Cancel the current backend/tagged backends |
Space |
Tag or untag the process |
q |
Quit |
Other |
Back to activity |
FAQ
I can't see my queries only TPS is shown
pg_activity scans the view pg_stat_activity with a user defined refresh
time comprised between O.5 and 5 seconds. It can be modified in the interface
with the + and - keys. Any query executed between two scans won't be
displayed.
What is more, pg_activity uses different queries to get :
- settings from
pg_settings - version info using
version() - queries and number of connections from
pg_stat_activity - locks from
pg_locks - tps from
pg_databaseusingpg_stat_get_db_xact_commit()andpg_stat_get_db_xact_rollback() - and more ( eg :
pg_cancel_backend()andpg_terminate_backend())
Thoses queries cannot be seen in the query tab because all queries issued from
the pg_activity backend are considered as noise and are not displayed . On
the other hand, the transactions used to get the info for pg_activity's
reporting are still accounted for by postgres in pg_stat_get_db_xact_commit()
and pg_stat_get_db_xact_commit(). Therefore pg_activity will display a non
zero TPS even with no activity on the database, and/or no activity displayed on
screen.
Project details
Release history Release notifications | RSS feed
Download files
Download the file for your platform. If you're not sure which to choose, learn more about installing packages.
Source Distribution
Built Distribution
File details
Details for the file pg_activity-2.0.0.tar.gz.
File metadata
- Download URL: pg_activity-2.0.0.tar.gz
- Upload date:
- Size: 281.1 kB
- Tags: Source
- Uploaded using Trusted Publishing? No
- Uploaded via: twine/1.13.0 pkginfo/1.4.2 requests/2.21.0 setuptools/40.8.0 requests-toolbelt/0.8.0 tqdm/4.28.1 CPython/3.7.3
File hashes
| Algorithm | Hash digest | |
|---|---|---|
| SHA256 | 919356b68c997fff4f12f08597febc01917276576f62b1c66651d9bb86b70ed5 |
|
| MD5 | 920de8823431b71a7aee7d89fd2ce66b |
|
| BLAKE2b-256 | dac3d5b58670ae024a68aa7a2442218a90aa30d37ee7ae0f17c4a2264f0cfccd |
File details
Details for the file pg_activity-2.0.0-py3-none-any.whl.
File metadata
- Download URL: pg_activity-2.0.0-py3-none-any.whl
- Upload date:
- Size: 37.4 kB
- Tags: Python 3
- Uploaded using Trusted Publishing? No
- Uploaded via: twine/1.13.0 pkginfo/1.4.2 requests/2.21.0 setuptools/40.8.0 requests-toolbelt/0.8.0 tqdm/4.28.1 CPython/3.7.3
File hashes
| Algorithm | Hash digest | |
|---|---|---|
| SHA256 | 7035d38cdd47f50496d1271a8fa002f93136b52e4528aa8c6aaf4f2cd0a05873 |
|
| MD5 | ee213cf06350ca896d5aca11f5c46bc7 |
|
| BLAKE2b-256 | 649b5d06a77a50e4ba4825c3c5cb81b5784e1dbf8ec40ec4a811018f22f662fe |


