A simple python package to print a keras NN training history.
Project description
A python package to print a Keras model training history
How do I install this package?
As usual, just download it using pip:
pip install plot_keras_historyTests Coverage
Since some software handling coverages sometime get slightly different results, here’s three of them:
Usage
Let’s say you have a model generated by the function my_keras_model:
Plotting a training history
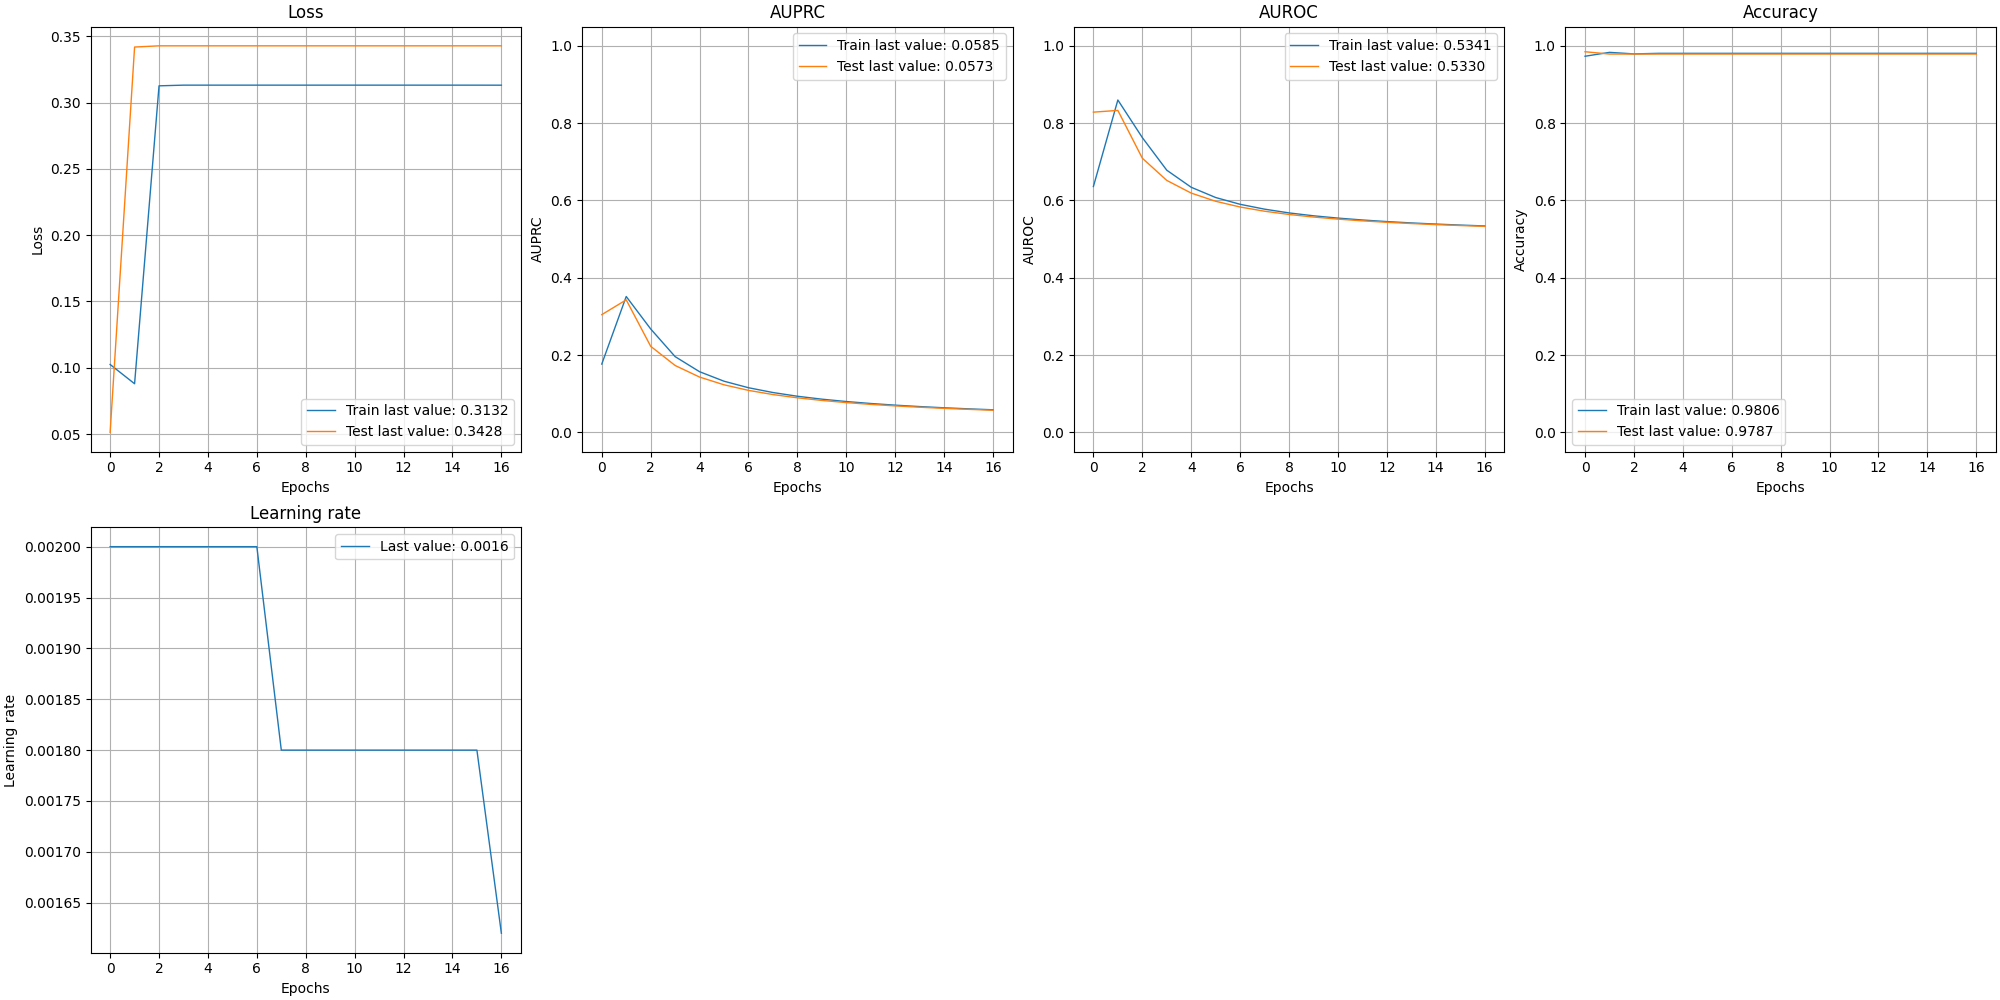
In the following example we will see how to plot and either show or save the training history:
from plot_keras_history import plot_history
import matplotlib.pyplot as plt

model = my_keras_model()
history = model.fit(...).history
plot_history(history)
plt.show()
plot_history(history, path="standard.png")
plt.close()
Plotting into separate graphs
By default, the graphs are all in one big image, but for various reasons you might need them one by one:
from plot_keras_history import plot_history
import matplotlib.pyplot as plt

model = my_keras_model()
history = model.fit(...).history
plot_history(history, path="singleton", single_graphs=True)
plt.close()
Reducing the history noise with Savgol Filters
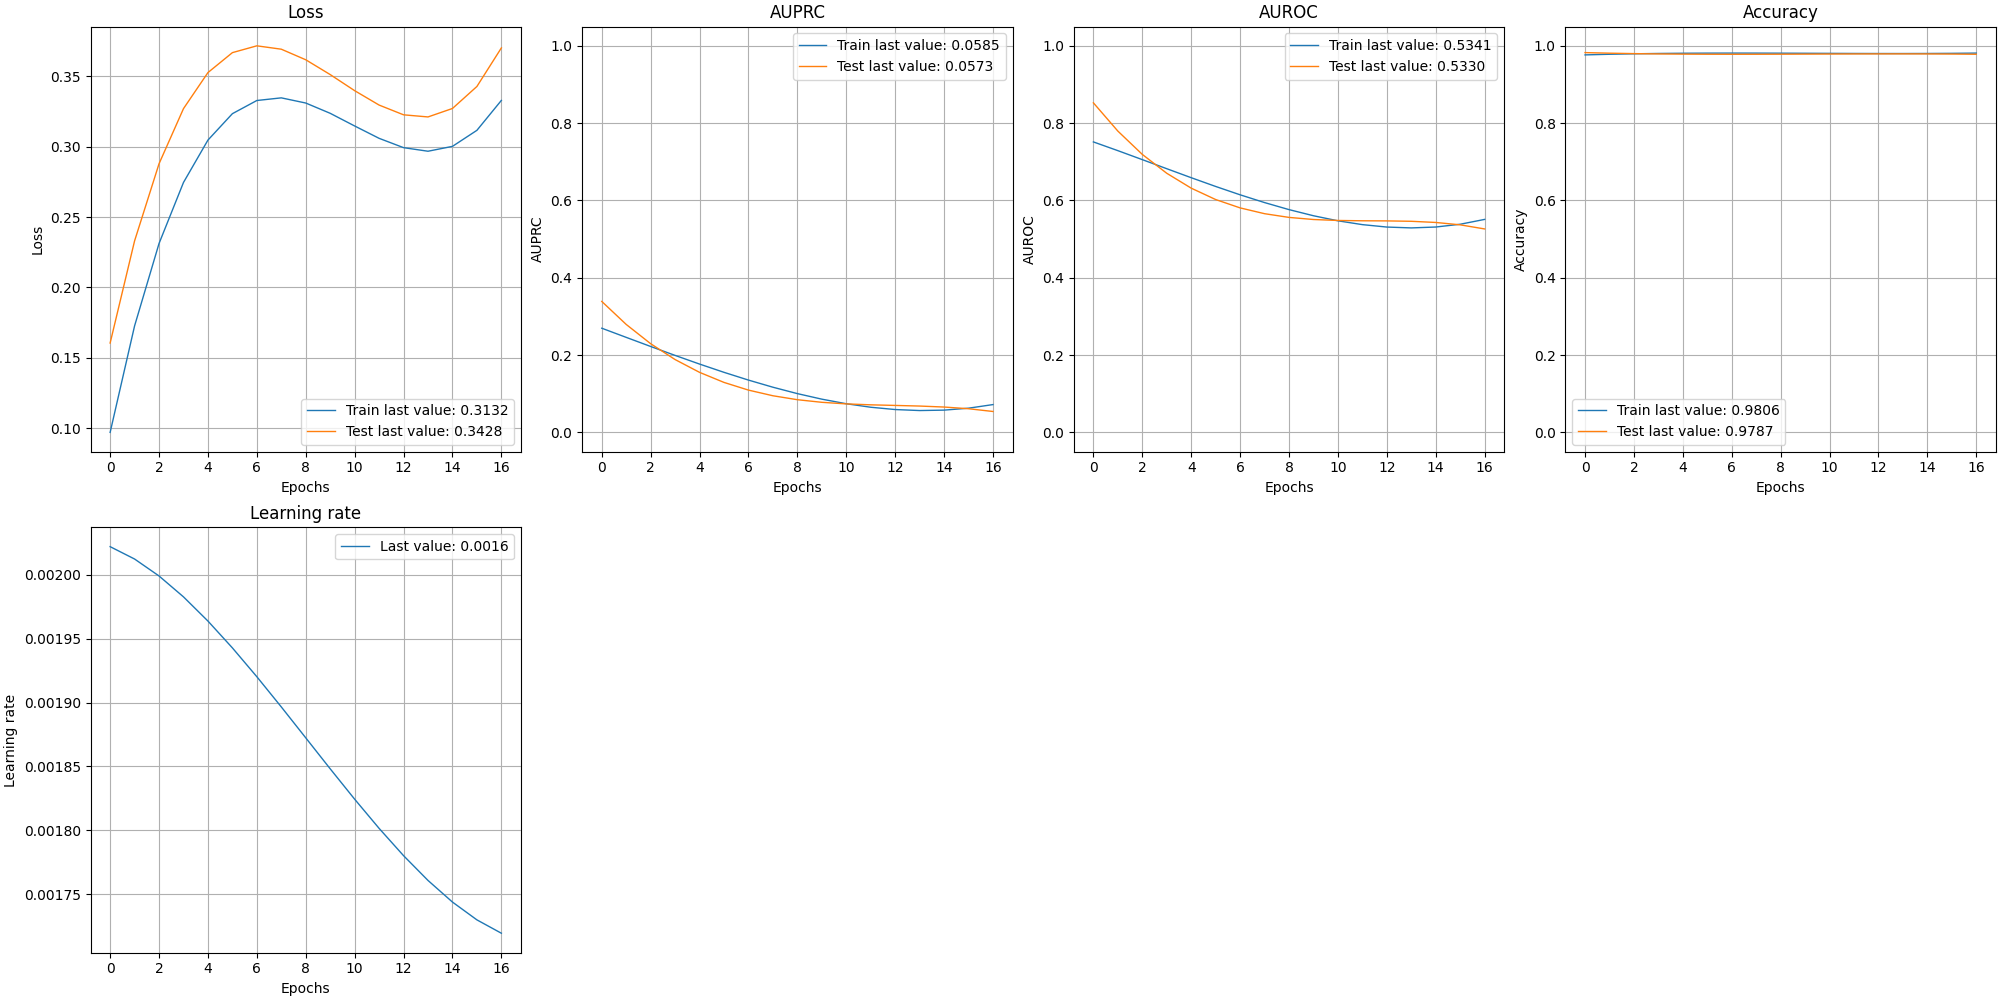
In some occasion it is necessary to be able to see the progress of the history to interpolate the results to remove a bit of noise. A parameter is offered to automatically apply a Savgol filter:
from plot_keras_history import plot_history
import matplotlib.pyplot as plt

model = my_keras_model()
history = model.fit(...).history
plot_history(history, path="interpolated.png", interpolate=True)
plt.close()
Automatic aliases
A number of metrics are automatically converted from the default ones to more talking ones, for example “lr” becomes “Learning Rate”, or “acc” becomes “Accuracy”.
All the available options
def plot_history(
    history, # Either the history object or a pandas DataFrame. When using a dataframe, the index name is used as abscissae label.
    style:str="-", # The style of the lines.
    interpolate: bool = False, # Wethever to interpolate or not the graphs datapoints.
    side: float = 5, # Dimension of the graphs side.
    graphs_per_row: int = 4, # Number of graphs for each row.
    customization_callback: Callable = None, # Callback for customizing the graphs.
    path: str = None, # Path where to store the resulting image or images (in the case of single_graphs)
    single_graphs: bool = False #  Wethever to save the graphs as single of multiples.
)
Chaining histories
It’s common to stop and restart a model’s training, and this would break the history object into two: for this reason the method chain_histories is available:
from plot_keras_history import chain_histories

model = my_keras_model()
history1 = model.fit(...).history
history2 = model.fit(...).history
history = chain_histories(history1, history2)
Extras
Numerous additional metrics are available in extra_keras_metrics
Project details
Release history Release notifications | RSS feed
Download files
Download the file for your platform. If you're not sure which to choose, learn more about installing packages.
Source Distribution
Hashes for plot_keras_history-1.1.28.tar.gz
| Algorithm | Hash digest | |
|---|---|---|
| SHA256 | 80a6b35ea4b1a41d0a366cb15147e68bdd503b99097e89d0d8dc377af4733be5 |
|
| MD5 | 9483135e8bb687c35416b1532faed264 |
|
| BLAKE2b-256 | ac81fb8f78385db08e5e8c28d0a6c6ada9bbb6fde5f7bb4050751f31156f6304 |


